

Question: Does anyone know how to solve for #2? 1) Use the stock price and S&P 500 index data and compute monthly returns: Provided below are
Does anyone know how to solve for #2?
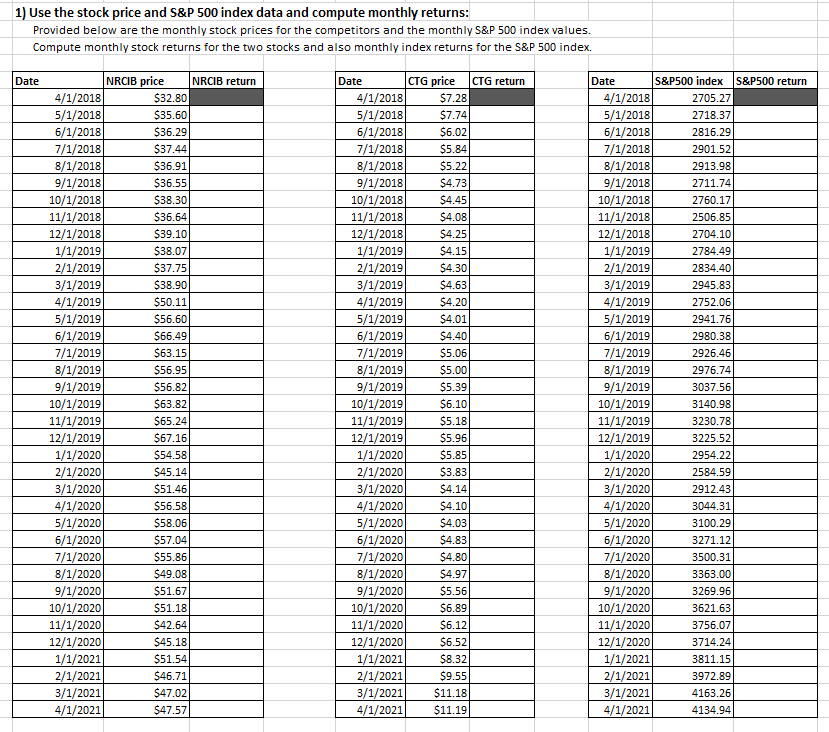
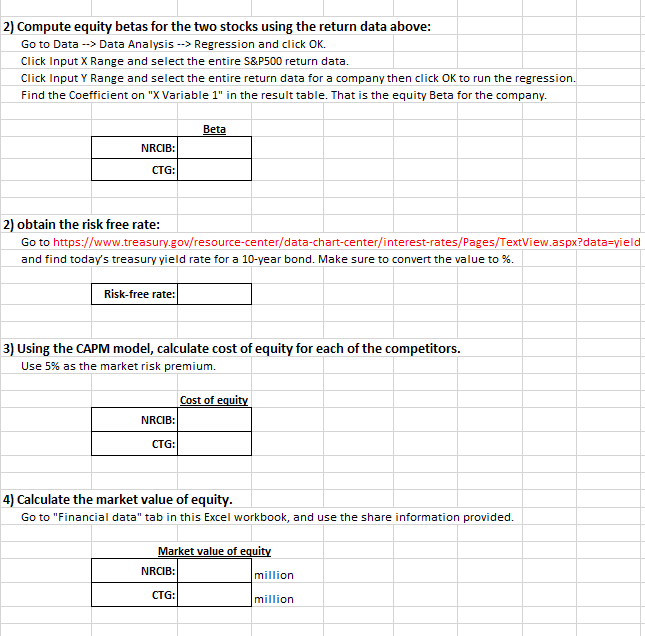
1) Use the stock price and S&P 500 index data and compute monthly returns: Provided below are the monthly stock prices for the competitors and the monthly S&P 500 index values. Compute monthly stock returns for the two stocks and also monthly index returns for the S&P 500 index. Date NRCIB price NRCIB return 4/1/2018 $32.80 5/1/2018 $35.60 6/1/2018 $36.29 7/1/2018 $37.44 8/1/2018 $36.91 9/1/2018 $36.55 10/1/2018 $38.30 11/1/2018 $36.64 12/1/2018 $39.10 1/1/2019 $38.07 2/1/2019 $37.75 3/1/2019 $38.90 4/1/2019 $50.11 5/1/2019 $56.60 6/1/2019 $66.49 7/1/2019 $63.15 8/1/2019 $56.95 9/1/2019 $56.82 10/1/2019 $63.82 11/1/2019 $65.24 12/1/2019 $67.16 1/1/2020 $54.58 2/1/2020 $45.14 3/1/2020 $51.46 4/1/2020 $56.58 5/1/2020 $58.06 6/1/2020 $57.04 7/1/2020 $55.86 8/1/2020 $49.08 9/1/2020 $51.67 10/1/2020 $51.18 11/1/2020 $42.64 12/1/2020 $45.18 1/1/2021 $51.54 2/1/2021 $46.71 3/1/2021 $47.02 4/1/2021 $47.57 Date CTG price CTG return 4/1/2018 $7.28 5/1/2018 $7.74 6/1/2018 $6.02 7/1/2018 $5.84 8/1/2018 $5.22 9/1/2018 $4.73 10/1/2018 $4.45 11/1/2018 $4.08 12/1/2018 $4.25 1/1/2019 $4.15 2/1/2019 $4.30 3/1/2019 $4.63 4/1/2019 $4.20 5/1/2019 $4.01 6/1/2019 $4.40 7/1/2019 $5.06 8/1/2019 $5.00 9/1/2019 $5.39 10/1/2019 $6.10 11/1/2019 $5.18 12/1/2019 $5.96 1/1/2020 $5.85 2/1/2020 $3.83 3/1/2020 $4.14 4/1/2020 $4.10 5/1/2020 $4.03 6/1/2020 $4.83 7/1/2020 $4.80 8/1/2020 $4.97 9/1/2020 $5.56 10/1/2020 $6.89 11/1/2020 $6.12 12/1/2020 $6.52 1/1/2021 $8.32 2/1/2021 $9.55 3/1/2021 $11.18 4/1/2021 $11.19 Date S&P500 index S&P500 return 4/1/2018 2705.27 5/1/2018 2718.37 6/1/2018 2816.29 7/1/2018 2901.52 8/1/2018 2913.98 9/1/2018 2711.74 10/1/2018 2760.17 11/1/2018 2506.85 12/1/2018 2704.10 1/1/2019 2784.49 2/1/2019 2834.40 3/1/2019 2945.83 4/1/2019 2752.06 5/1/2019 2941.76 6/1/2019 2980.38 7/1/2019 2926.46 8/1/2019 2976.74 9/1/2019 3037.56 10/1/2019 3140.98 11/1/2019 3230.78 12/1/2019 3225.52 1/1/2020 2954.22 2/1/2020 2584.59 3/1/2020 2912.43 4/1/2020 3044.31 5/1/2020 3100.29 6/1/2020 3271.12 7/1/2020 3500.31 8/1/2020 3363.00 9/1/2020 3269.96 10/1/2020 3621.63 11/1/2020 3756.07 12/1/2020 3714.24 1/1/2021 3811.15 2/1/2021 3972.89 3/1/2021 4163.26 4/1/2021 4134.94 2) Compute equity betas for the two stocks using the return data above: Go to Data --> Data Analysis --> Regression and click OK. Click Input X Range and select the entire S&P500 return data. Click Input Y Range and select the entire return data for a company then click OK to run the regression. Find the Coefficient on "X Variable 1" in the result table. That is the equity Beta for the company. Beta NRCIB: CTG: 2) obtain the risk free rate: Go to https://www.treasury.gov/resource center/data-chart-center/interest-rates/Pages/TextView.aspx?data=yield and find today's treasury yield rate for a 10-year bond. Make sure to convert the value to %. Risk-free rate: 3) Using the CAPM model, calculate cost of equity for each of the competitors. Use 5% as the market risk premium. Cost of equity NRCIB: CTG: 4) Calculate the market value of equity. Go to "Financial data" tab in this Excel workbook, and use the share information provided. Market value of equity NRCIB: million CTG: million 1) Use the stock price and S&P 500 index data and compute monthly returns: Provided below are the monthly stock prices for the competitors and the monthly S&P 500 index values. Compute monthly stock returns for the two stocks and also monthly index returns for the S&P 500 index. Date NRCIB price NRCIB return 4/1/2018 $32.80 5/1/2018 $35.60 6/1/2018 $36.29 7/1/2018 $37.44 8/1/2018 $36.91 9/1/2018 $36.55 10/1/2018 $38.30 11/1/2018 $36.64 12/1/2018 $39.10 1/1/2019 $38.07 2/1/2019 $37.75 3/1/2019 $38.90 4/1/2019 $50.11 5/1/2019 $56.60 6/1/2019 $66.49 7/1/2019 $63.15 8/1/2019 $56.95 9/1/2019 $56.82 10/1/2019 $63.82 11/1/2019 $65.24 12/1/2019 $67.16 1/1/2020 $54.58 2/1/2020 $45.14 3/1/2020 $51.46 4/1/2020 $56.58 5/1/2020 $58.06 6/1/2020 $57.04 7/1/2020 $55.86 8/1/2020 $49.08 9/1/2020 $51.67 10/1/2020 $51.18 11/1/2020 $42.64 12/1/2020 $45.18 1/1/2021 $51.54 2/1/2021 $46.71 3/1/2021 $47.02 4/1/2021 $47.57 Date CTG price CTG return 4/1/2018 $7.28 5/1/2018 $7.74 6/1/2018 $6.02 7/1/2018 $5.84 8/1/2018 $5.22 9/1/2018 $4.73 10/1/2018 $4.45 11/1/2018 $4.08 12/1/2018 $4.25 1/1/2019 $4.15 2/1/2019 $4.30 3/1/2019 $4.63 4/1/2019 $4.20 5/1/2019 $4.01 6/1/2019 $4.40 7/1/2019 $5.06 8/1/2019 $5.00 9/1/2019 $5.39 10/1/2019 $6.10 11/1/2019 $5.18 12/1/2019 $5.96 1/1/2020 $5.85 2/1/2020 $3.83 3/1/2020 $4.14 4/1/2020 $4.10 5/1/2020 $4.03 6/1/2020 $4.83 7/1/2020 $4.80 8/1/2020 $4.97 9/1/2020 $5.56 10/1/2020 $6.89 11/1/2020 $6.12 12/1/2020 $6.52 1/1/2021 $8.32 2/1/2021 $9.55 3/1/2021 $11.18 4/1/2021 $11.19 Date S&P500 index S&P500 return 4/1/2018 2705.27 5/1/2018 2718.37 6/1/2018 2816.29 7/1/2018 2901.52 8/1/2018 2913.98 9/1/2018 2711.74 10/1/2018 2760.17 11/1/2018 2506.85 12/1/2018 2704.10 1/1/2019 2784.49 2/1/2019 2834.40 3/1/2019 2945.83 4/1/2019 2752.06 5/1/2019 2941.76 6/1/2019 2980.38 7/1/2019 2926.46 8/1/2019 2976.74 9/1/2019 3037.56 10/1/2019 3140.98 11/1/2019 3230.78 12/1/2019 3225.52 1/1/2020 2954.22 2/1/2020 2584.59 3/1/2020 2912.43 4/1/2020 3044.31 5/1/2020 3100.29 6/1/2020 3271.12 7/1/2020 3500.31 8/1/2020 3363.00 9/1/2020 3269.96 10/1/2020 3621.63 11/1/2020 3756.07 12/1/2020 3714.24 1/1/2021 3811.15 2/1/2021 3972.89 3/1/2021 4163.26 4/1/2021 4134.94 2) Compute equity betas for the two stocks using the return data above: Go to Data --> Data Analysis --> Regression and click OK. Click Input X Range and select the entire S&P500 return data. Click Input Y Range and select the entire return data for a company then click OK to run the regression. Find the Coefficient on "X Variable 1" in the result table. That is the equity Beta for the company. Beta NRCIB: CTG: 2) obtain the risk free rate: Go to https://www.treasury.gov/resource center/data-chart-center/interest-rates/Pages/TextView.aspx?data=yield and find today's treasury yield rate for a 10-year bond. Make sure to convert the value to %. Risk-free rate: 3) Using the CAPM model, calculate cost of equity for each of the competitors. Use 5% as the market risk premium. Cost of equity NRCIB: CTG: 4) Calculate the market value of equity. Go to "Financial data" tab in this Excel workbook, and use the share information provided. Market value of equity NRCIB: million CTG: million
Step by Step Solution
There are 3 Steps involved in it

Get step-by-step solutions from verified subject matter experts