

Question: Does effort correlate with a student's statistics grade? Below is a chart of effort versus final grade for a statistics course 1 previously taught with
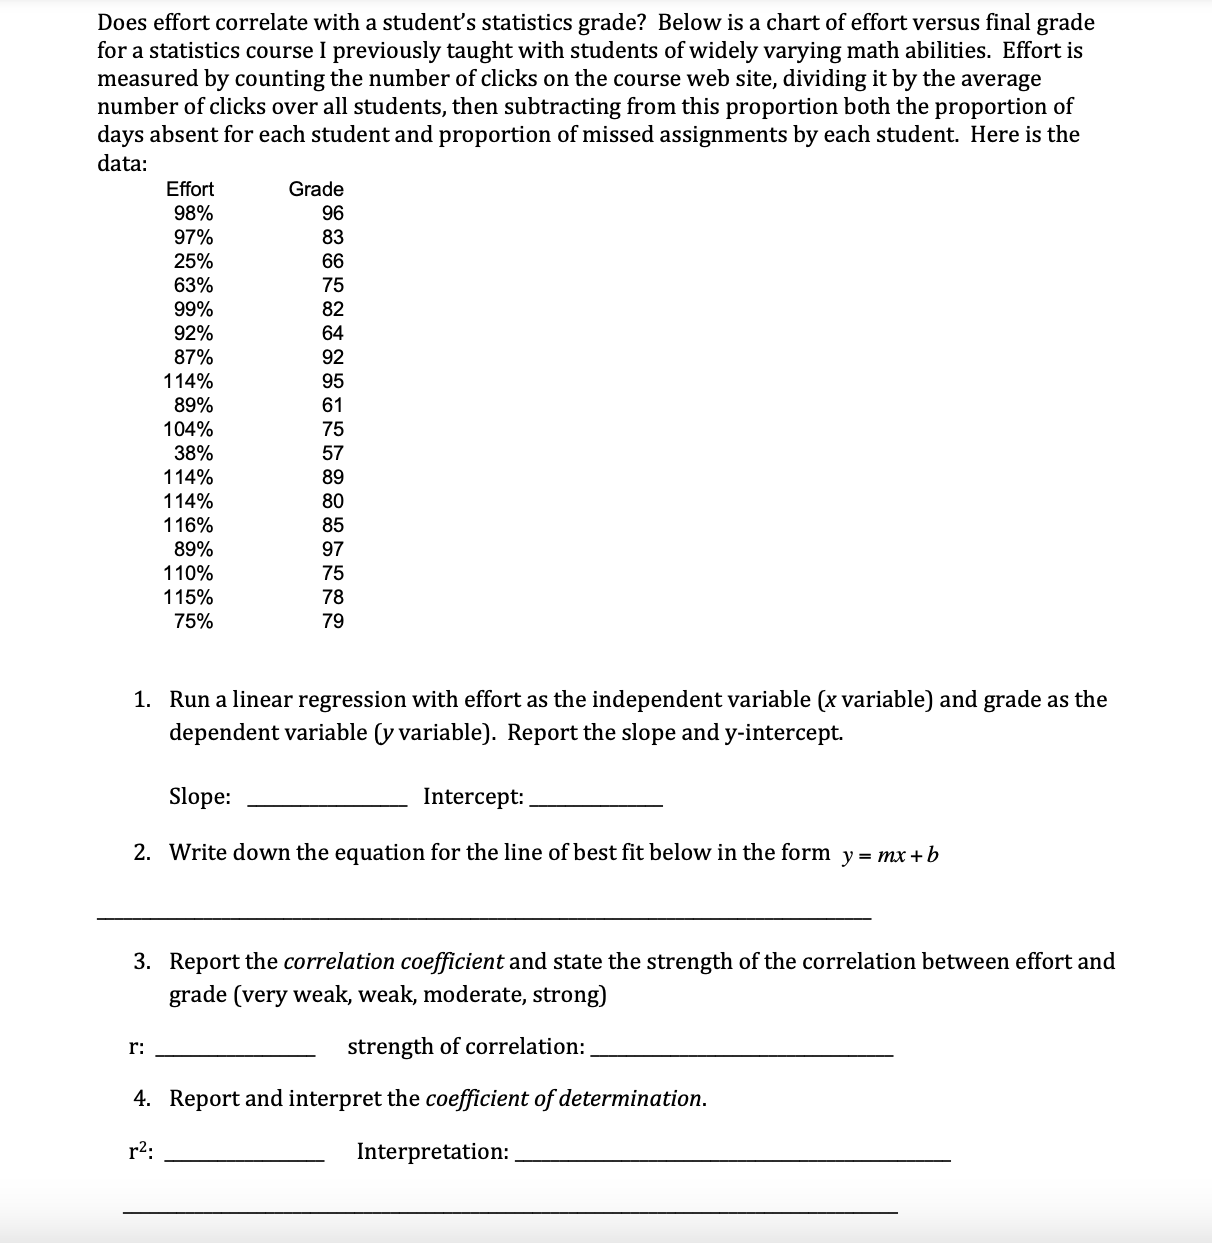
Does effort correlate with a student's statistics grade? Below is a chart of effort versus final grade for a statistics course 1 previously taught with students of widely varying math abilities. Effort is measured by counting the number of clicks on the course web site, dividing it by the average number of clicks over all students, then subtracting from this proportion both the proportion of days absent for each student and proportion of missed assignments by each student. Here is the data: Effort Grade 98% 96 97% 83 25% 66 63% 75 99% 82 92% 64 87% 92 114% 95 89% 61 104% 75 38% 57 114% 89 114% 80 116% 85 89% 97 110% 75 115% 78 75% 79 1. Run a linear regression with effort as the independent variable [x variable) and grade as the dependent variable (y variable). Report the slope and y-intercept. Slope: Intercept: 2. Write down the equation for the line of best fit below in the form y = mx + b 3. Report the correlation coe'icient and state the strength of the correlation between effort and grade (very weak, weak, moderate, strong) r: strength of correlation: 4. Report and interpret the coefficient of determination. r2: Interpretation: 5. Interpret the slope; interpret the y-intercept Slope: Y-lntercept: 13(- Grade 6. Graph the scatter plot on your calculator and copy the scatter plot as accurately as you can on the graph to left: .50 - 7. Graph the regression line from your calculator . on the graph to the left as accurately as you can. Effort 99 100 III!) L: 8. Based upon your regression equation, predict the grade of a person with an effort rating of 100%: ; and also for an effort rating of 50%: 9. Calculate the residual for the 3rd observation: . for the 7'h observation: 10. Report the p-value for the signicance of the slope. P-Value: . Based upon the pvalue, does the slope appear to be signicant? Based upon this result, discuss whether or not any correlation between effort and grade appears to be a real correlation, or is rather just the result of sampling variation. Explain your reasoning
Step by Step Solution
There are 3 Steps involved in it

Get step-by-step solutions from verified subject matter experts