

Question: Does electricity consumption increase with square footage? Conduct a linear regression test to find out. Your response variable is ELCNS and the explanatory variable is

Does electricity consumption increase with square footage? Conduct a linear regression test to find out. Your response variable is ELCNS and the explanatory variable is SQFT.
You must complete the following:
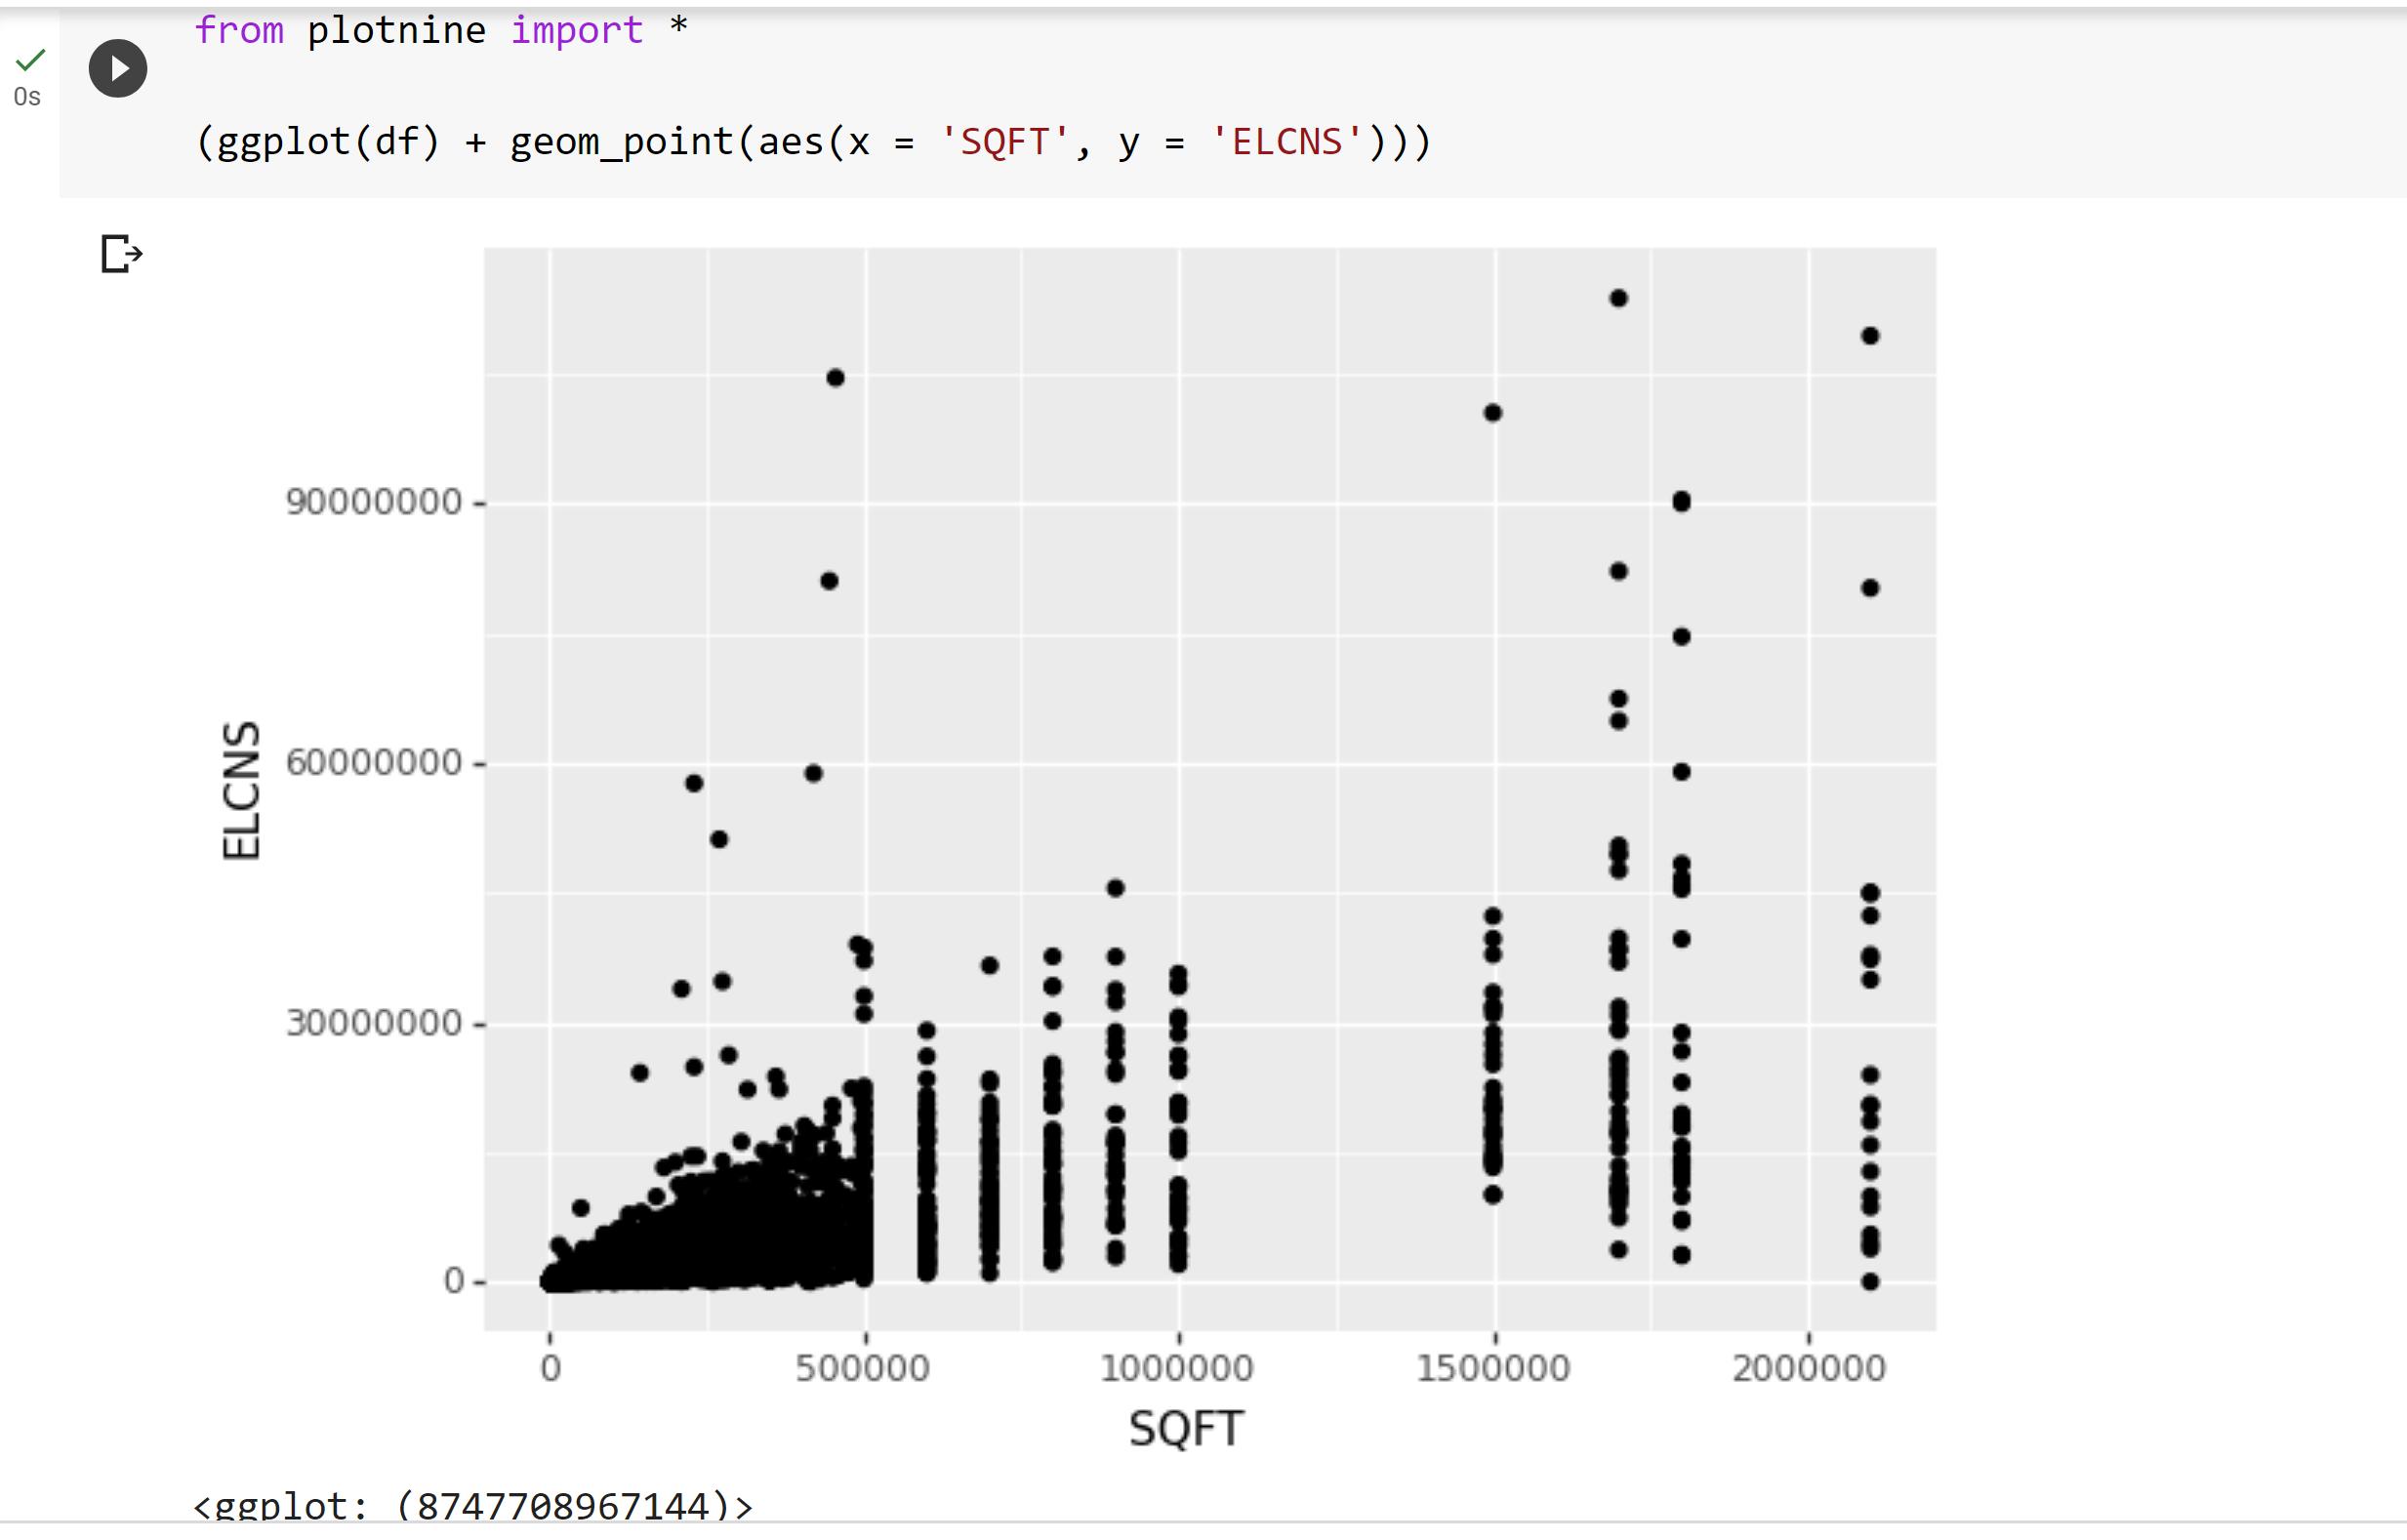
Plot a scatterplot of these two variables (on appropriate axes). Are the conditions for fitting a simple linear model reasonably met? If not, what condition(s) is/are broken?
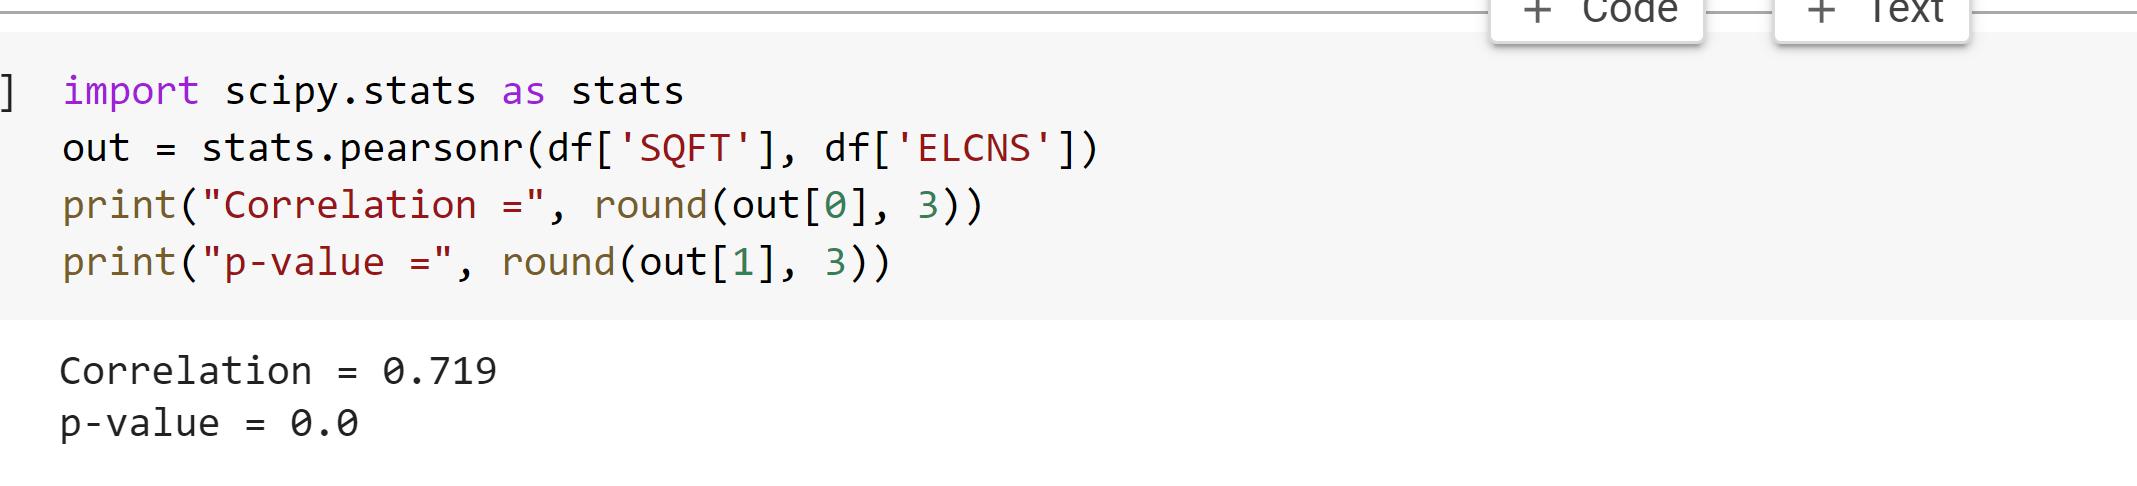
Correlation Test: Find the correlation between the two variables
- State the hypotheses
- Conduct the test
- Report the correlation coefficient value
- Report the p-value
- State your conclusion including the significance level you are using
Slope Test: Regardless of your answer in 2.1 above, fit the appropriate simple linear model.
- State the hypotheses for testing the significance of the slope
- Conduct the test
- Report the slope value
- Report the p-value
- State your conclusion including the significance level you are using
Find the R2 value. Interpret this value in terms of the ability of the model to explain the variance in the data (e.g., "goodness-of-fit").
Find the F-statistic and the p-value. Is there evidence that the model is effective?
Making Predictions: Suppose you are planning to build a 2,500,000 ft2 building and a 30,000 ft2 building.
- What is the predicted electricity consumption for both of these buildings?
- What is the 95% prediction interval for both buildings?
df.head (10) 0 1 2 3 4 5 6 7 8 9 REGION CENDIV PBA 3 4 3 3 1 3 4 2 4 1 5 9 5 7 LO 5 2 5483285 210000 2 448027 2 5 8 15354 5 ELCNS SQFT NFLOOR NELVTR YRCONC MONUSE WKHRS PCTERMN LAPTPN SERVERN PKLTN HDD65 CDD65 14 8 14 3 5 28000 578621 240000 791765 2100 378243 295000 8 25 725930 94000 586563 41000 877997 122000 96000 2 14 1461170 220000 994 5 1 1 1 2 2 2 1 3 8 1 0 0 0 1 1 2 0 1 2 6 6 9 4 7 8 4 8 3 12 12 12 12 12 12 12 12 12 12 70 45 48 55 80 60 50 168 95 80 250 20 2 15 10 25 80 40 10 90 50 5 5 10 0 800 250 25 0 20 100 1 1 1 0 1 3 30 4463 1759 1 1 40 2424 10 2 180 40 450 1045 3041 300 3218 2403 500 5076 4830 1924 150 4540 189 5054 120 8497 1316 1143 3577 1184 1269 598
Step by Step Solution
3.46 Rating (153 Votes )
There are 3 Steps involved in it
1 Plot a scatterplot of the two variables ELCNS and SQFT Please plot a scatter plot using the data points from the given dataset where ELCNS is the response variable and SQFT is the explanatory variab... View full answer

Get step-by-step solutions from verified subject matter experts