

Question: Does prison really deter violent crime? Let x represent percent change in the rate of violent crime and y represent percent change in the
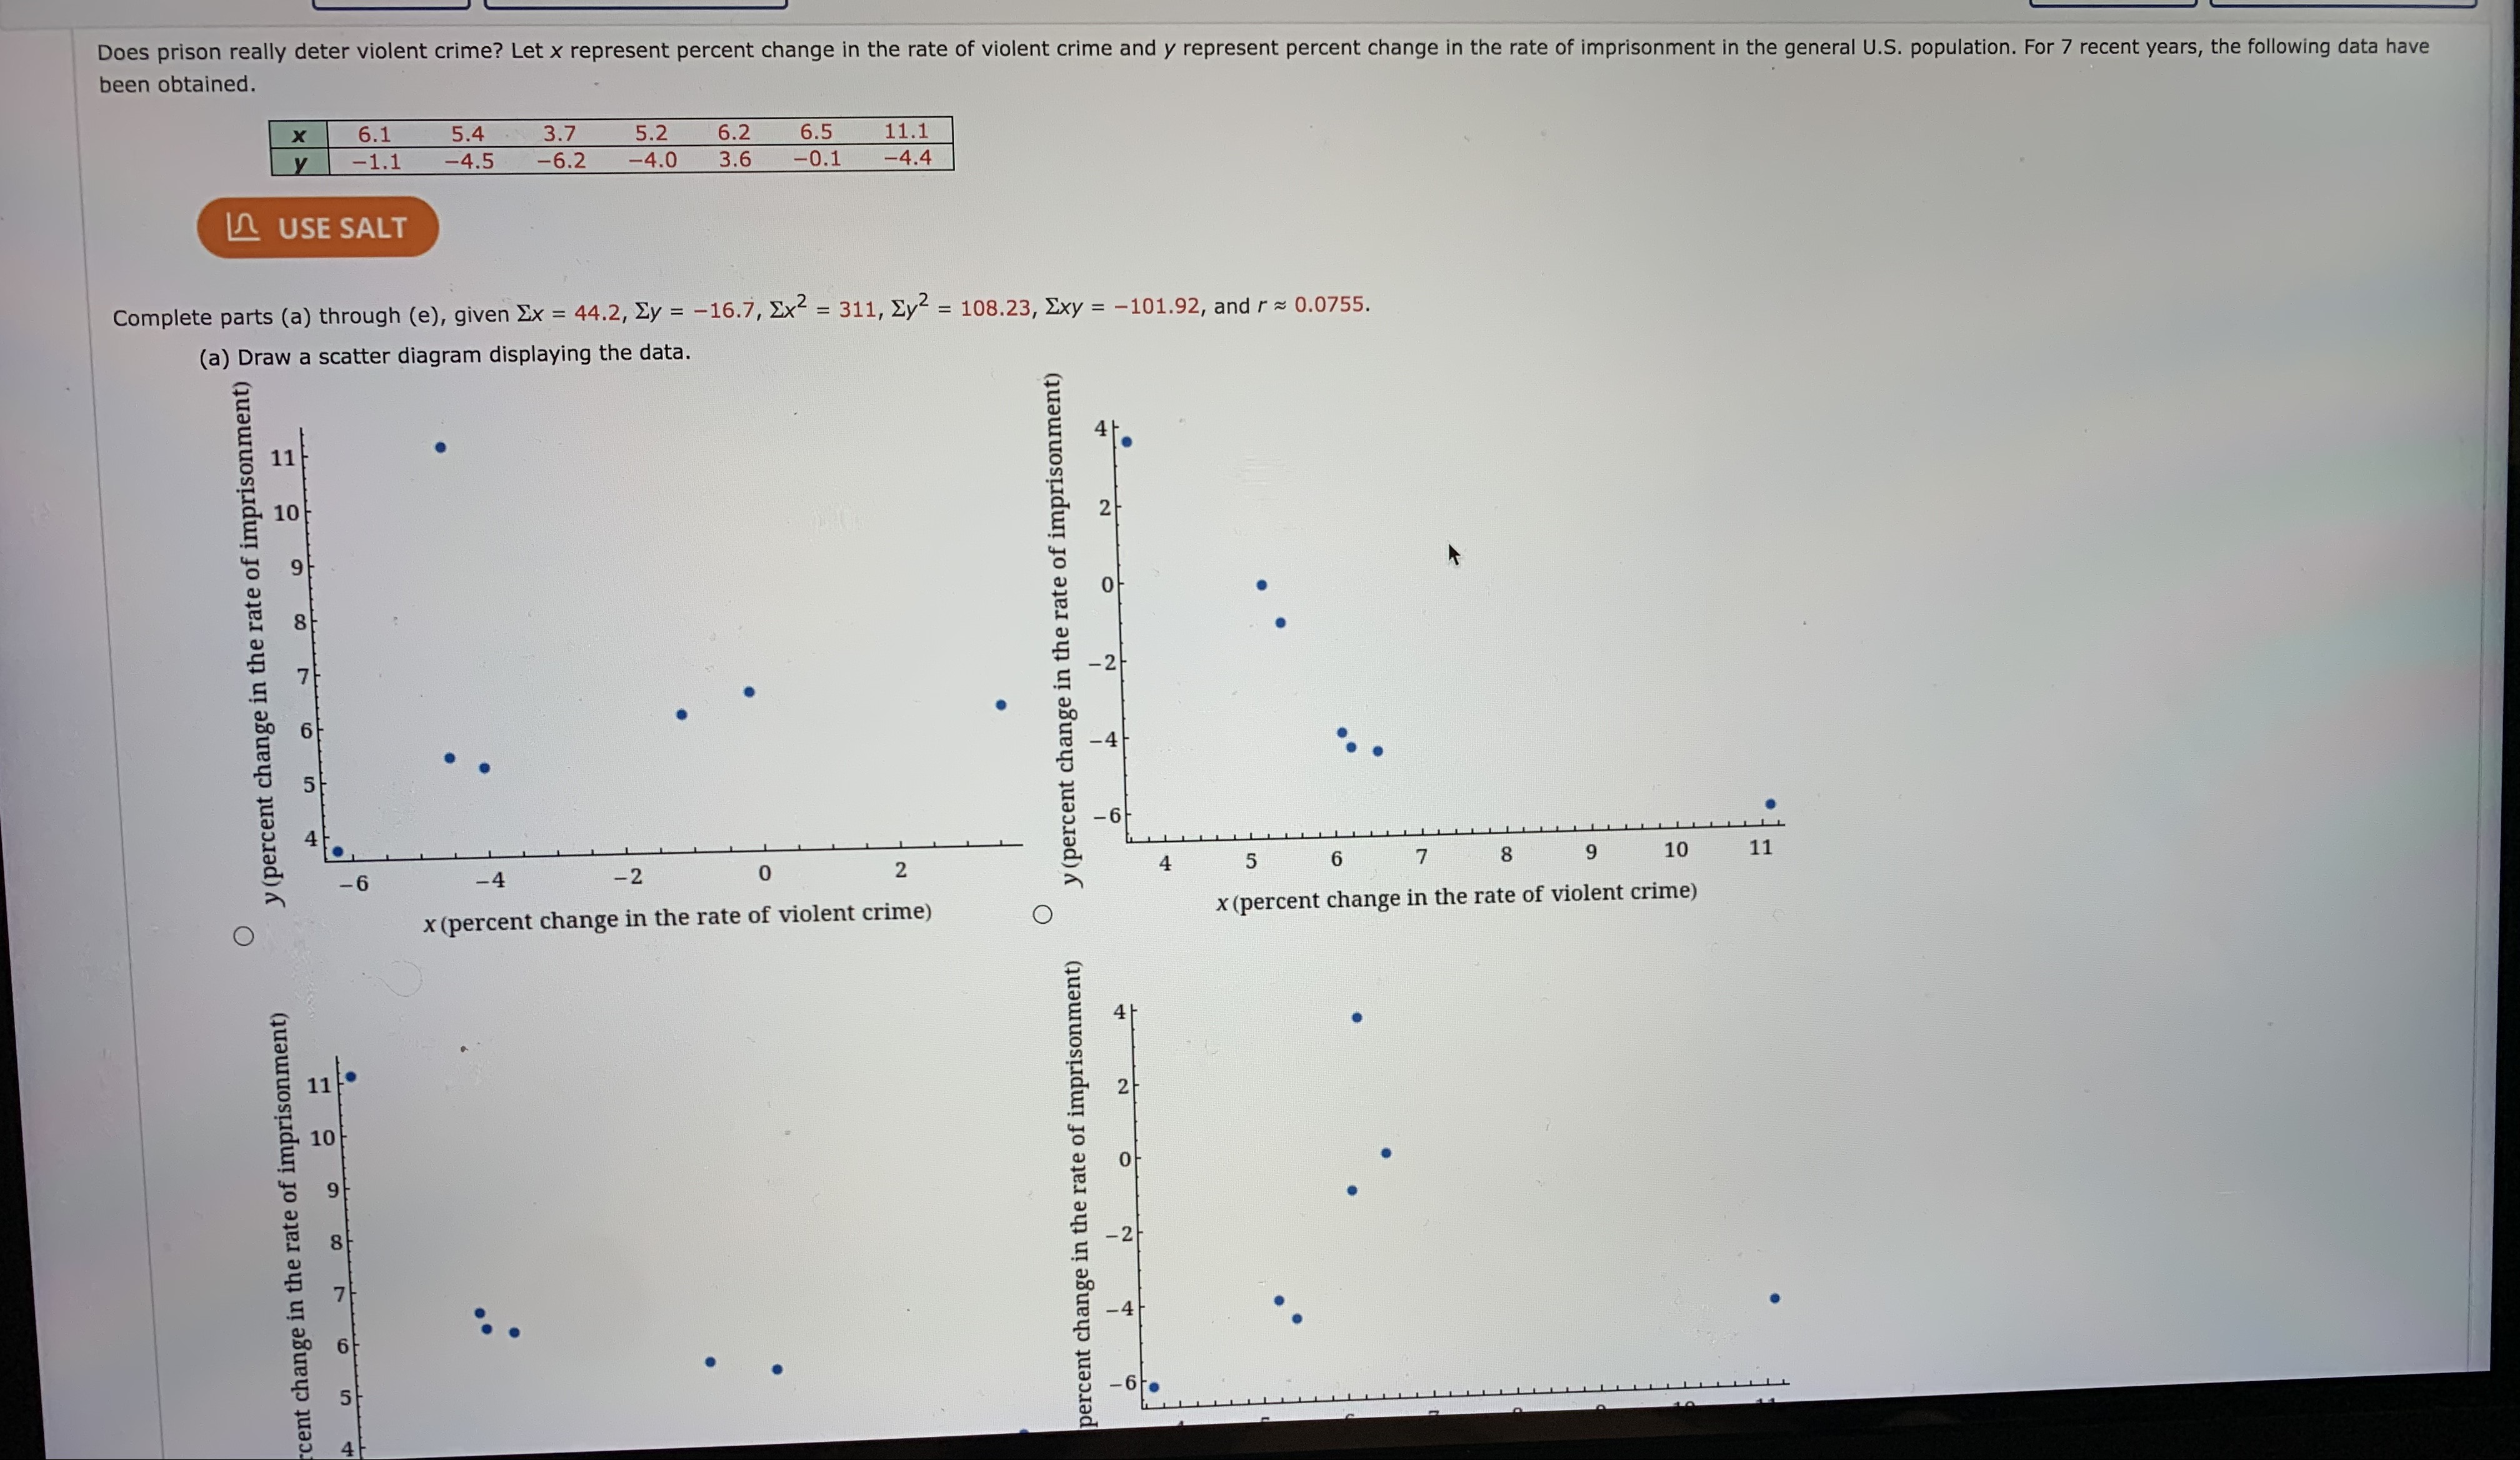
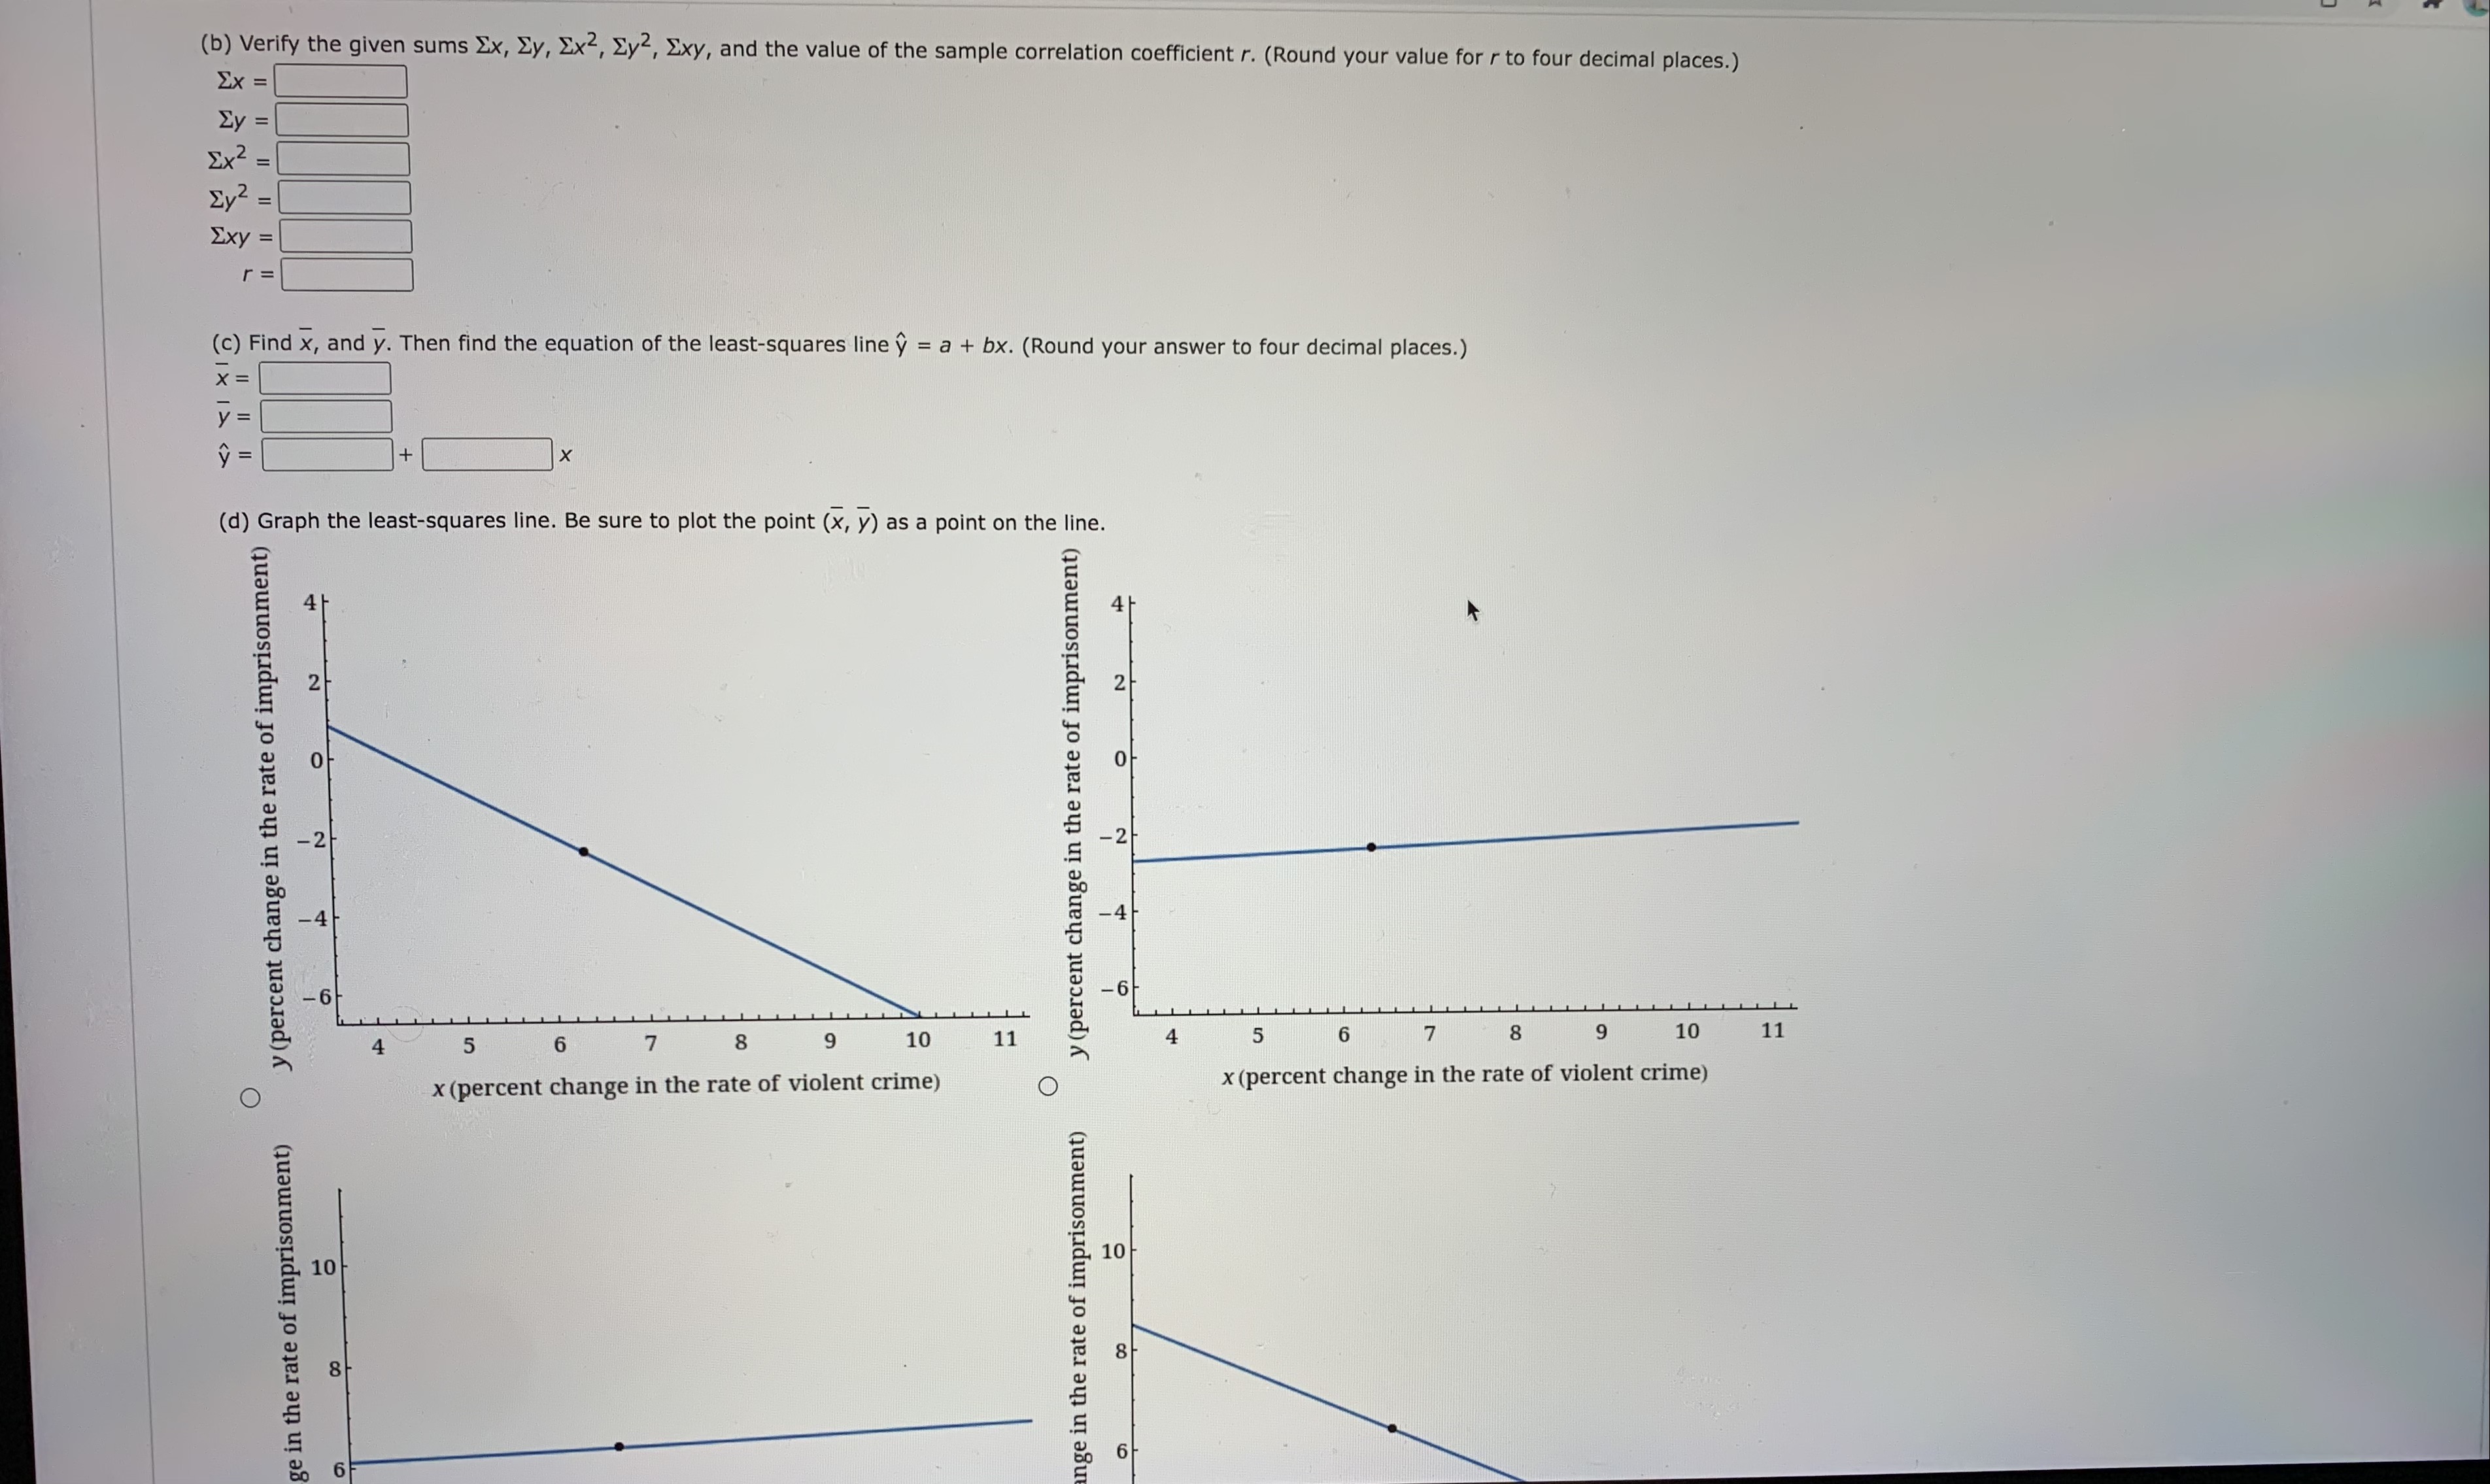
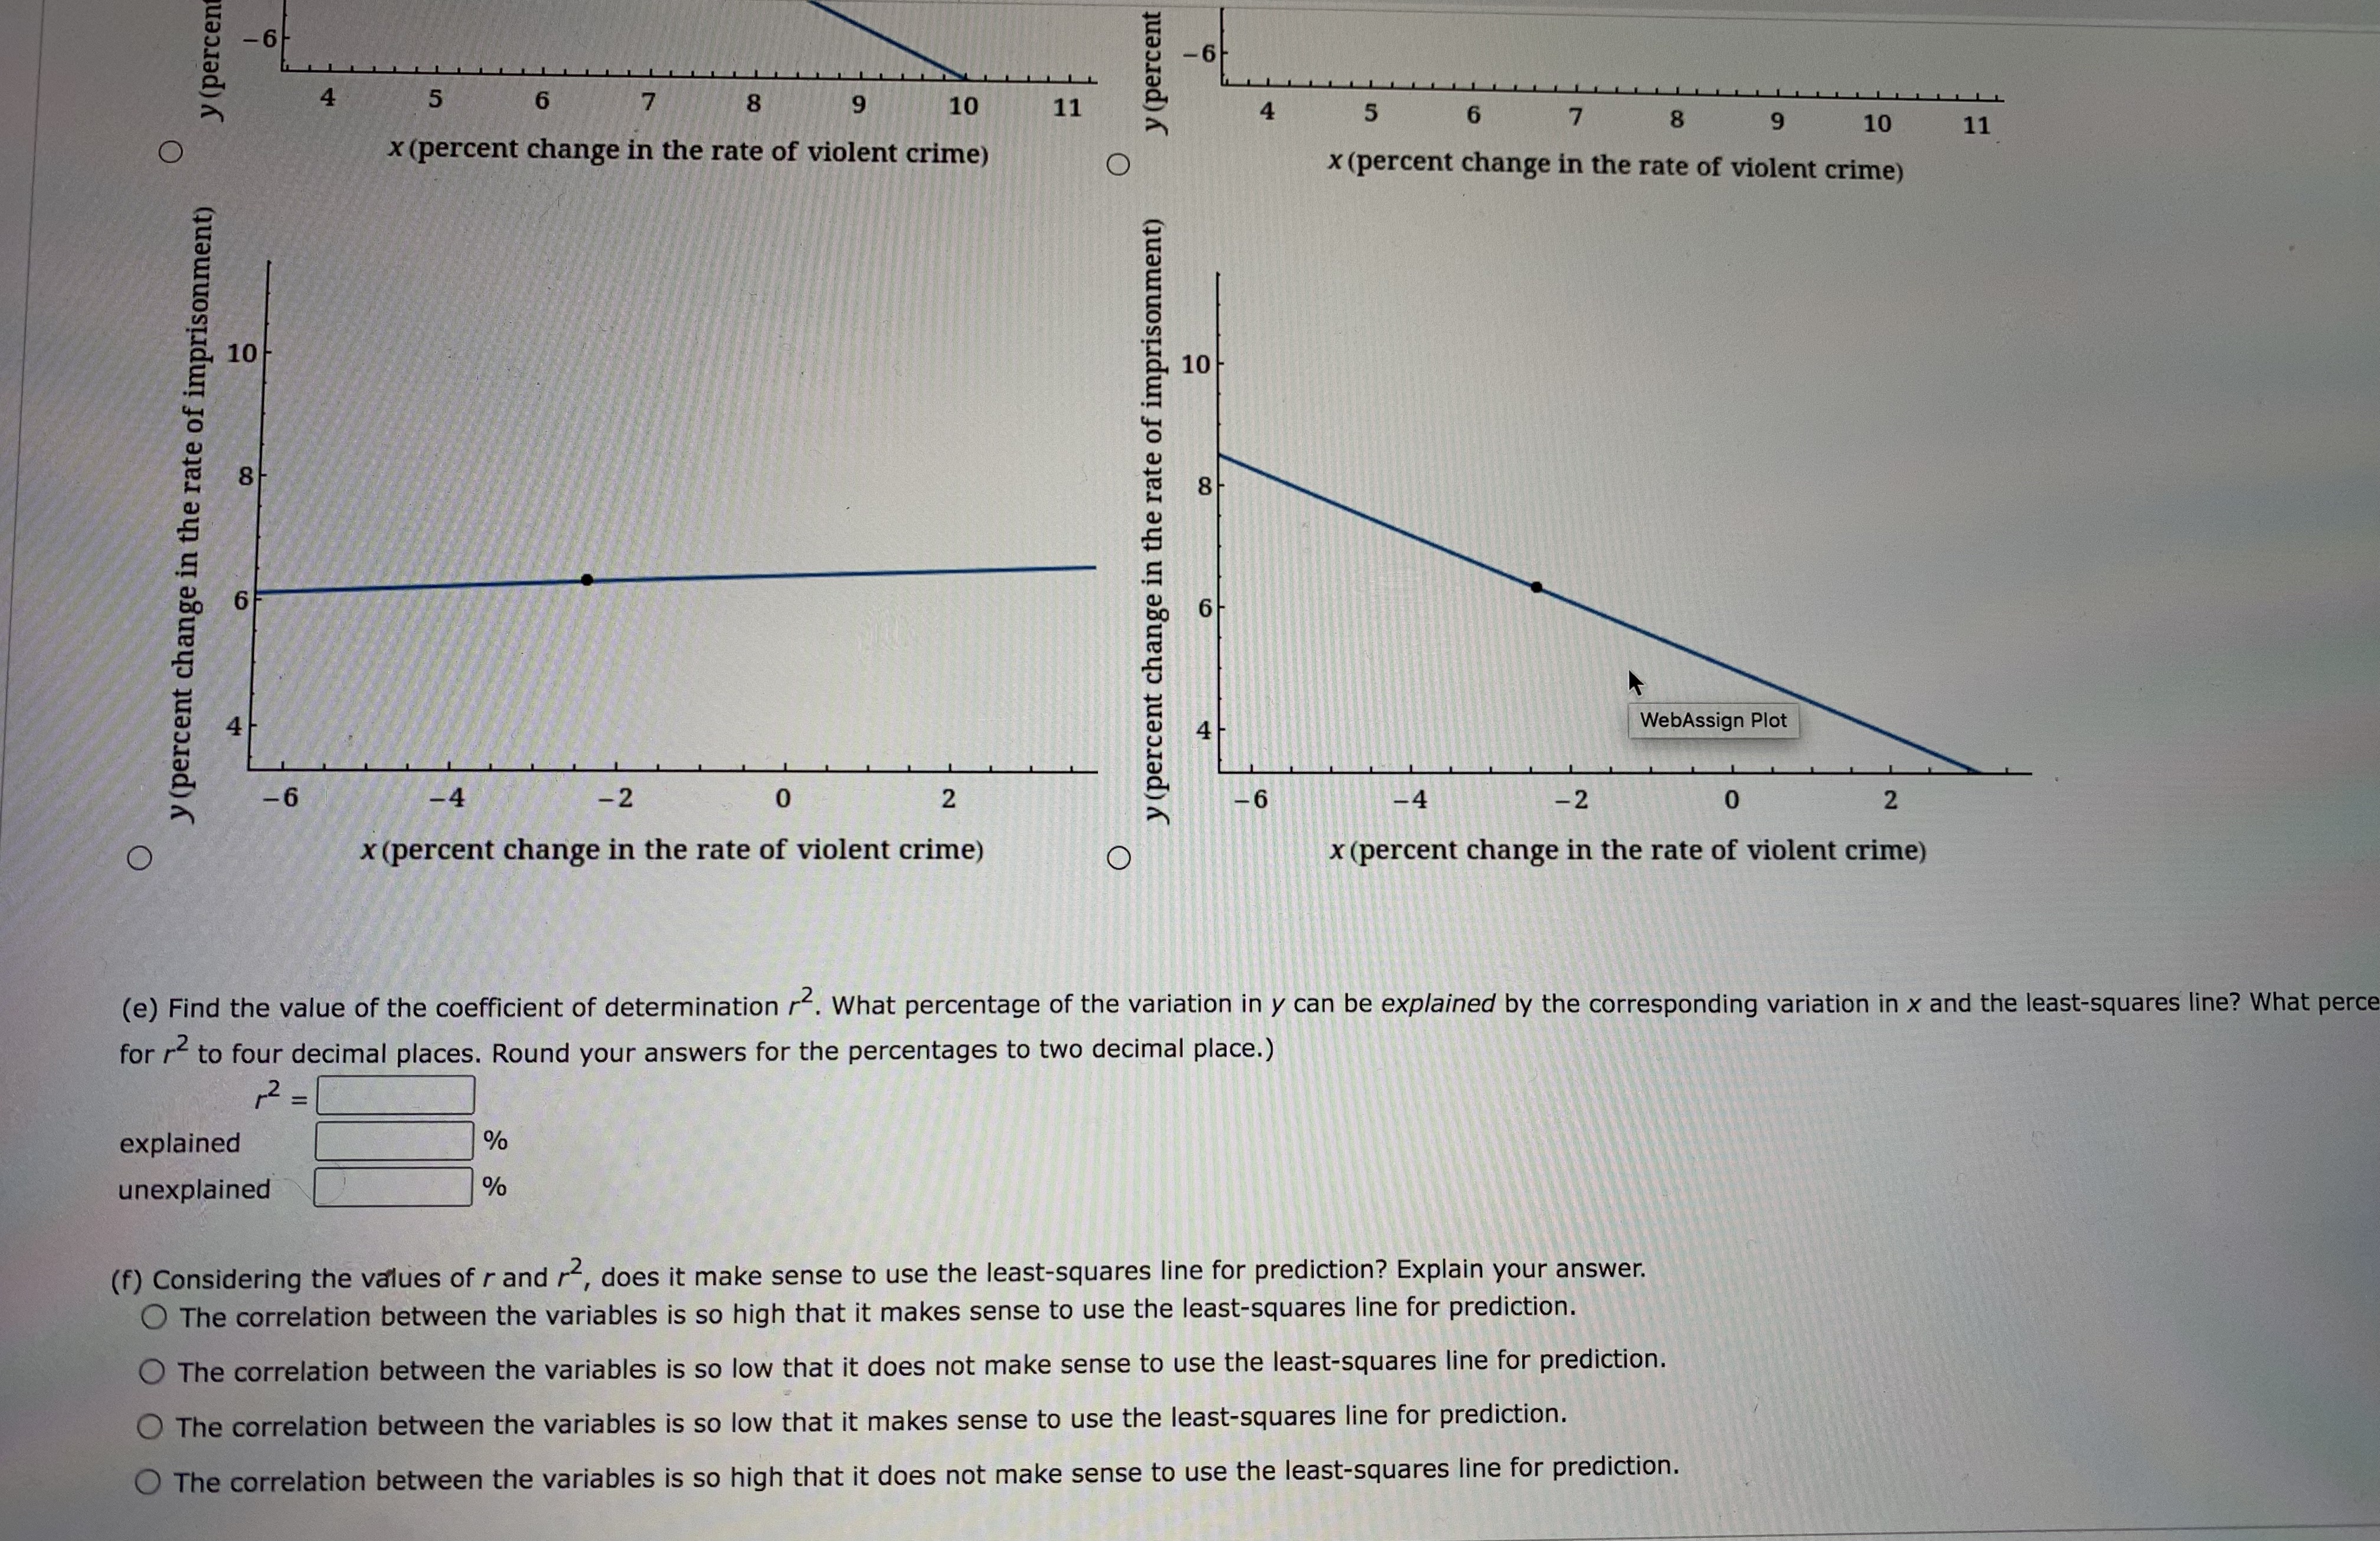
Does prison really deter violent crime? Let x represent percent change in the rate of violent crime and y represent percent change in the rate of imprisonment in the general U.S. population. For 7 recent years, the following data have been obtained. X 6.1 y -1.1 5.4 -4.5 3.7 -6.2 5.2 6.2 6.5 -4.0 3.6 -0.1 11.1 -4.4 USE SALT Complete parts (a) through (e), given x = 44.2, y = -16.7, Ex = 311, Zy = 108.23, xy = -101.92, and r 0.0755. (a) Draw a scatter diagram displaying the data. 5 4 -6 -4 -2 0 2 x (percent change in the rate of violent crime) cent change in the rate of imprisonment) 9 8 7 6 5 4 10 10 y (percent change in the rate of imprisonment) 6 8 7 10 10 6 11 y (percent change in the rate of imprisonment) percent change in the rate of imprisonment) 0 2 -4 2 4 5 6 7 8 9 10 11 x (percent change in the rate of violent crime) (b) Verify the given sums Ex, Ey, Ex, Ey2, Exy, and the value of the sample correlation coefficient r. (Round your value for r to four decimal places.) : = y = = = xy = (c) Find x, and y. Then find the equation of the least-squares line = a + bx. (Round your answer to four decimal places.) r = X = + (d) Graph the least-squares line. Be sure to plot the point (x, y) as a point on the line. 2 0 -2 9. 2 0 -2 -6 4 5 6 7 8 9 10 11 ange in the rate of imprisonment) y (percent change in the rate of imprisonment) 4 5 6 7 8 9 10 11 x (percent change in the rate of violent crime) ge in the rate of imprisonment) y (percent change in the rate of imprisonment) 10 8 9 10 10 co x (percent change in the rate of violent crime) 9 y (percent change in the rate of imprisonment) 4 6 8 10 y (percent -6 4 5 6 7 8 9 10 11 x (percent change in the rate of violent crime) -6 -4 -2 0 2 x (percent change in the rate of violent crime) y (percent y (percent change in the rate of imprisonment) I 10 9 8 6 4 4 5 6 7 8 9 10 11 -6 x (percent change in the rate of violent crime) -4 -2 WebAssign Plot 0 2 x (percent change in the rate of violent crime) (e) Find the value of the coefficient of determination r. What percentage of the variation in y can be explained by the corresponding variation in x and the least-squares line? What perce for r to four decimal places. Round your answers for the percentages to two decimal place.) , = explained unexplained % % (f) Considering the values of r and 2, does it make sense to use the least-squares line for prediction? Explain your answer. The correlation between the variables is so high that it makes sense to use the least-squares line for prediction. The correlation between the variables is so low that it does not make sense to use the least-squares line for prediction. The correlation between the variables is so low that it makes sense to use the least-squares line for prediction. The correlation between the variables is so high that it does not make sense to use the least-squares line for prediction.
Step by Step Solution
There are 3 Steps involved in it

Get step-by-step solutions from verified subject matter experts