

Question: Does the graph suggest that responents are able to select more than one flavor? Select your answer (2 out of 15) Does the graph suggest
Does the graph suggest that responents are able to select more than one flavor?
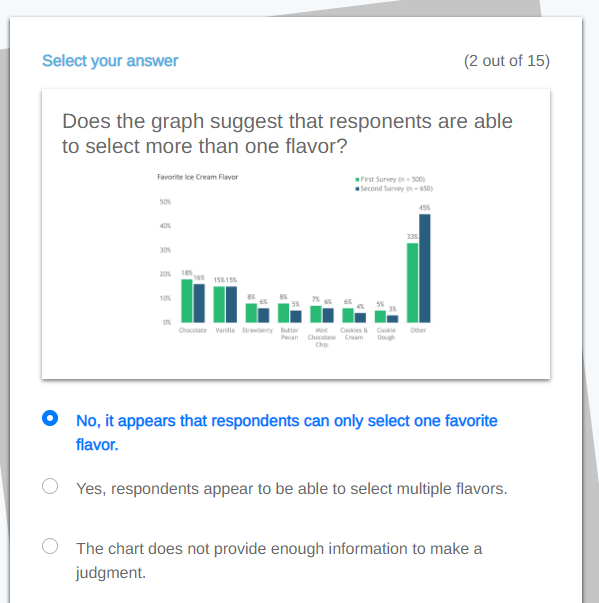
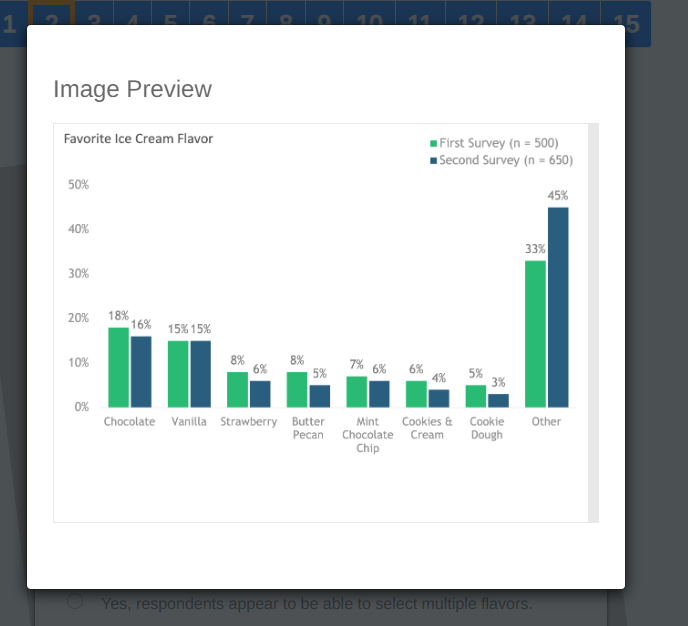
Select your answer (2 out of 15) Does the graph suggest that responsnts are able to select more than one flavor? Favorite Ice Cream Flavor First Survey in = 500) Second Survey in = 650) EE Dracolate Vandia Fire-long Cookie Other Pecan Chocolate Cream No, it appears that respondents can only select one favorite flavor. O Yes, respondents appear to be able to select multiple flavors. The chart does not provide enough information to make a judgment.Image Preview Favorite Ice Cream Flavor First Survey (n = 500) Second Survey (n = 650) 50% 15% 10% 33% 30% 20% 18% 16% 15% 15% 10% 8% 8% 6% 7% 6% 5% 49 5% 3% 0% Chocolate Vanilla Strawberry Butter Mint Cookies & Cookie Other Pecan Chocolate Cream Dough Chip O Yes, respondents appear to be able to select multiple flavors
Step by Step Solution
There are 3 Steps involved in it

Get step-by-step solutions from verified subject matter experts