Question: does the mean intake score for the same attribution group fall within the range of the two scores that you gave as your answer to
does the mean intake score for the same attribution group fall within the range of the two scores that you gave as your answer to question 5? that the middle 95% of the participants' scores lie between 33.9 and 57.5.
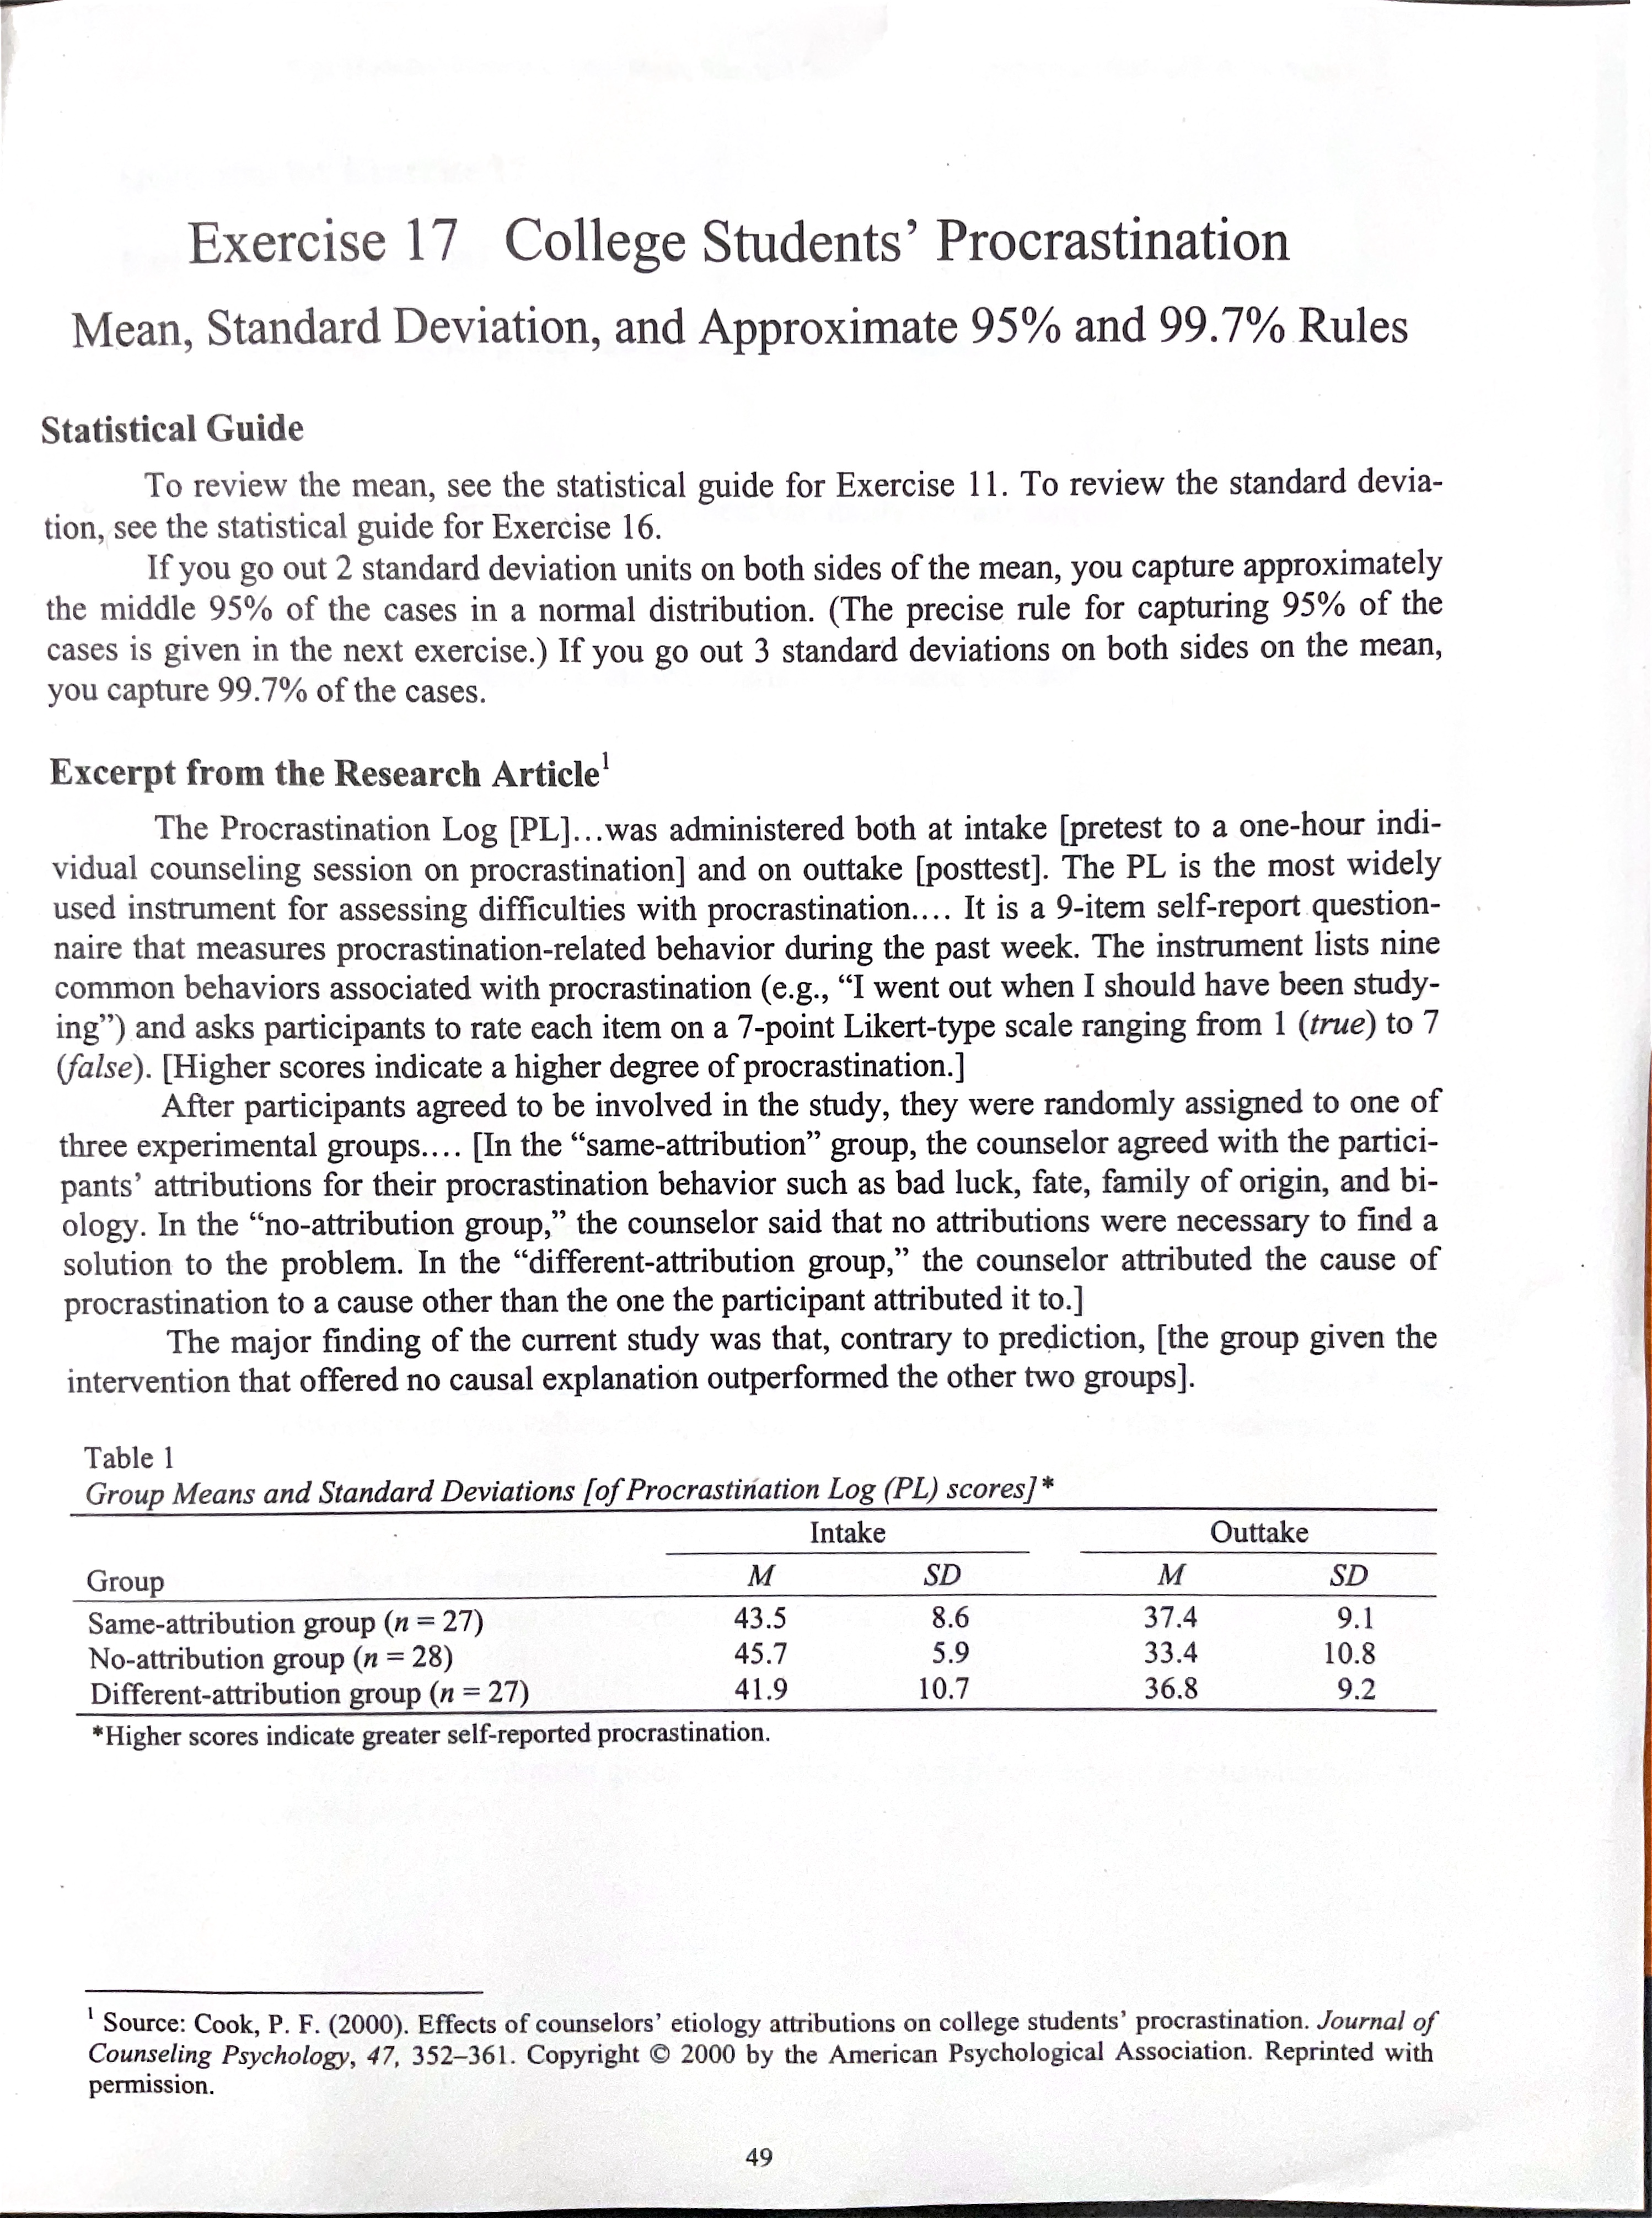
Exercise 17 College Students' Procrastination Mean, Standard Deviation, and Approximate 95% and 99.7% Rules Statistical Guide To review the mean, see the statistical guide for Exercise 11. To review the standard devia- tion, see the statistical guide for Exercise 16. If you go out 2 standard deviation units on both sides of the mean, you capture approximately the middle 95% of the cases in a normal distribution. (The precise rule for capturing 95% of the cases is given in the next exercise.) If you go out 3 standard deviations on both sides on the mean, you capture 99.7% of the cases. Excerpt from the Research Article' The Procrastination Log [PL]...was administered both at intake [pretest to a one-hour indi- vidual counseling session on procrastination] and on outtake [posttest]. The PL is the most widely used instrument for assessing difficulties with procrastination.... It is a 9-item self-report question- naire that measures procrastination-related behavior during the past week. The instrument lists nine common behaviors associated with procrastination (e.g., \"I went out when I should have been study- ing\") and asks participants to rate each item on a 7-point Likert-type scale ranging from 1 (rue) to 7 (false). [Higher scores indicate a higher degree of procrastination. ] After participants agreed to be involved in the study, they were randomly assigned to one of three experimental groups.... [In the \"'same-attribution\" group, the counselor agreed with the partici- pants' attributions for their procrastination behavior such as bad luck, fate, family of origin, and bi- ology. In the \"no-attribution group,\" the counselor said that no attributions were necessary to find a solution to the problem. In the \"different-attribution group,\" the counselor attributed the cause of procrastination to a cause other than the one the participant attributed it to. ] The major finding of the current study was that, contrary to prediction, [the group given the intervention that offered no causal explanation outperformed the other two groups]. Table 1 Group Means and Standard Deviations [of Procrastination Log (PL) scores]* Intake Outtake Group M SD M SD Same-attribution group (n = 27) 43.5 8.6 37.4 9.1 No-attribution group (\" = 28) 45.7 5.9 33.4 10.8 Different-attribution group (n = 27) 41.9 10.7 36.8 9.2 *Higher scores indicate greater self-reported procrastination. ' Source: Cook, P. F. (2000). Effects of counselors' etiology attributions on college students' procrastination. Journal of Counseling Psychology, 47, 352-361. Copyright 2000 by the American Psychological Association. Reprinted with permission