

Question: Does the scatter diagram indicate any influential observations? SelectYesNoItem 2 b. Compute the standardized residuals for these data (to 2 decimals, if necessary). Enter negative
Does the scatter diagram indicate any influential observations?
SelectYesNoItem 2
b. Compute the standardized residuals for these data (to 2 decimals, if necessary). Enter negative values as negative numbers.
| Observation 1 | |
| Observation 2 | |
| Observation 3 | |
| Observation 4 | |
| Observation 5 | |
| Observation 6 | |
| Observation 7 | |
| Observation 8 |
Do the data include any outliers?
SelectYes, there appear to be 3 outliersYes, there appear to be 2 outliersYes, there appears to be an outlierNo, there do not appear to be any outliersItem 11
c. Compute the leverage values for these data (to 2 decimals). Enter negative values as negative numbers.
| Observation 1 | |
| Observation 2 | |
| Observation 3 | |
| Observation 4 | |
| Observation 5 | |
| Observation 6 | |
| Observation 7 | |
| Observation 8 |
-Does there appear to be any influential observations in these data?
-SelectYes, observation 8 is an influential observationYes, observation 6 is an influential observationYes, observation 3 is an influential observationNo, there do not appear to be any influential observationsItem 20
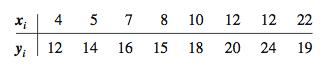
4 5 7 8 10 12 12 22 12 14 16 15 18 20 24 19
Step by Step Solution
3.36 Rating (146 Votes )
There are 3 Steps involved in it
The Scatter plot diagram for the given data a Yes there is an influential obse... View full answer

Get step-by-step solutions from verified subject matter experts