

Question: Does your class data show evidence for rational or irrational decision making? coglab dicision making In this experiment each participant was in one of 2
Does your class data show evidence for rational or irrational decision making? coglab dicision making
In this experiment each participant was in one of 2 versions:
- Problem Set 1
- Problem Set 2
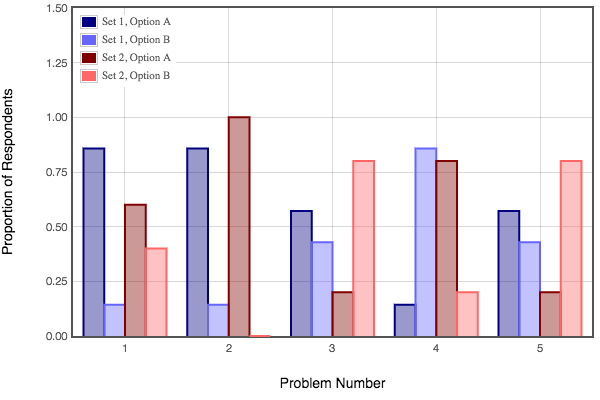
The graph and tables show the proportion of participants who chose either option A or B for each problem. The comparison to focus on is across the two problem sets. Both sets of problems ask essentially the same questions, but in different ways. The expected finding is that the choice preferences will differ across the sets for the matching problems.
Data Summary: Problem Set 1
Means based on data from 7 participants.
| Problem Number | Option A | Option B |
|---|---|---|
| Problem 1 | 0.857 | 0.143 |
| Problem 2 | 0.857 | 0.143 |
| Problem 3 | 0.571 | 0.429 |
| Problem 4 | 0.143 | 0.857 |
| Problem 5 | 0.571 | 0.429 |
Standard deviations based on data from 7 participants.
| Problem Number | Option A | Option B |
|---|---|---|
| Problem 1 | 0.378 | 0.378 |
| Problem 2 | 0.378 | 0.378 |
| Problem 3 | 0.535 | 0.535 |
| Problem 4 | 0.378 | 0.378 |
| Problem 5 | 0.535 | 0.535 |
Data Summary: Problem Set 2
Means based on data from 5 participants.
| Problem Number | Option A | Option B |
|---|---|---|
| Problem 1 | 0.600 | 0.400 |
| Problem 2 | 1.000 | 0.000 |
| Problem 3 | 0.200 | 0.800 |
| Problem 4 | 0.800 | 0.200 |
| Problem 5 | 0.200 | 0.800 |
Standard deviations based on data from 5 participants.
| Problem Number | Option A | Option B |
|---|---|---|
| Problem 1 | 0.548 | 0.548 |
| Problem 2 | 0.000 | 0.000 |
| Problem 3 | 0.447 | 0.447 |
| Problem 4 | 0.447 | 0.447 |
| Problem 5 | 0.447 | 0.447 |
Step by Step Solution
There are 3 Steps involved in it

Get step-by-step solutions from verified subject matter experts