

Question: Dollar Value The following Tableau Dashboard shows a trend line over the course of Year 1 for two different industries. Each graph reports the
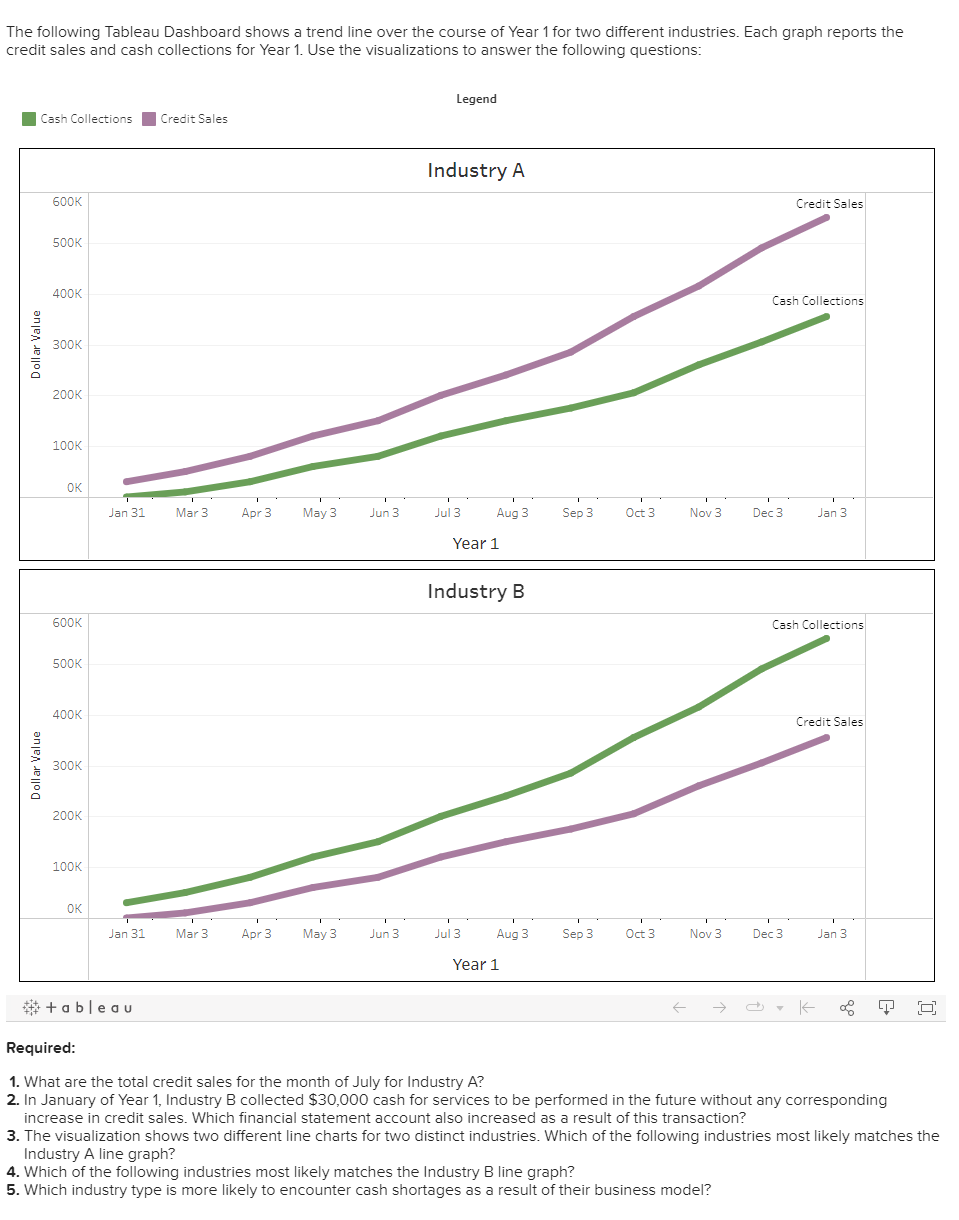
Dollar Value The following Tableau Dashboard shows a trend line over the course of Year 1 for two different industries. Each graph reports the credit sales and cash collections for Year 1. Use the visualizations to answer the following questions: Dollar Value Cash Collections Credit Sales 600K 500K 400K 300K 200K 100K Legend Industry A Credit Sales Cash Collections Jan 31 Mar 3 Apr 3 May 3 Jun 3 Jul 3 Aug 3 Sep 3 Oct 3 Nov 3 Dec 3 Jan 3 Year 1 600K 500K 400K 300K 200K 100K Industry B Cash Collections Credit Sales Jan 31 Mar 3 Apr 3 May 3 Jun 3 Jul 3 Aug 3 Sep 3 Oct 3 Nov 3 Dec 3 Jan 3 Year 1 +ableau K Required: 1. What are the total credit sales for the month of July for Industry A? 2. In January of Year 1, Industry B collected $30,000 cash for services to be performed in the future without any corresponding increase in credit sales. Which financial statement account also increased as a result of this transaction? 3. The visualization shows two different line charts for two distinct industries. Which of the following industries most likely matches the Industry A line graph? 4. Which of the following industries most likely matches the Industry B line graph? 5. Which industry type is more likely to encounter cash shortages as a result of their business model?
Step by Step Solution
There are 3 Steps involved in it
Answers to Dollar Value Tableau Dashboard Questions Total Credit Sales for Industry A in July Due to ... View full answer

Get step-by-step solutions from verified subject matter experts