

Question: Done 3 myopenmath.com AA C C9 2hr555mins X 0 Question 9 v E 0/1 pt '0 2 6) Details To compute a student's Grade Point


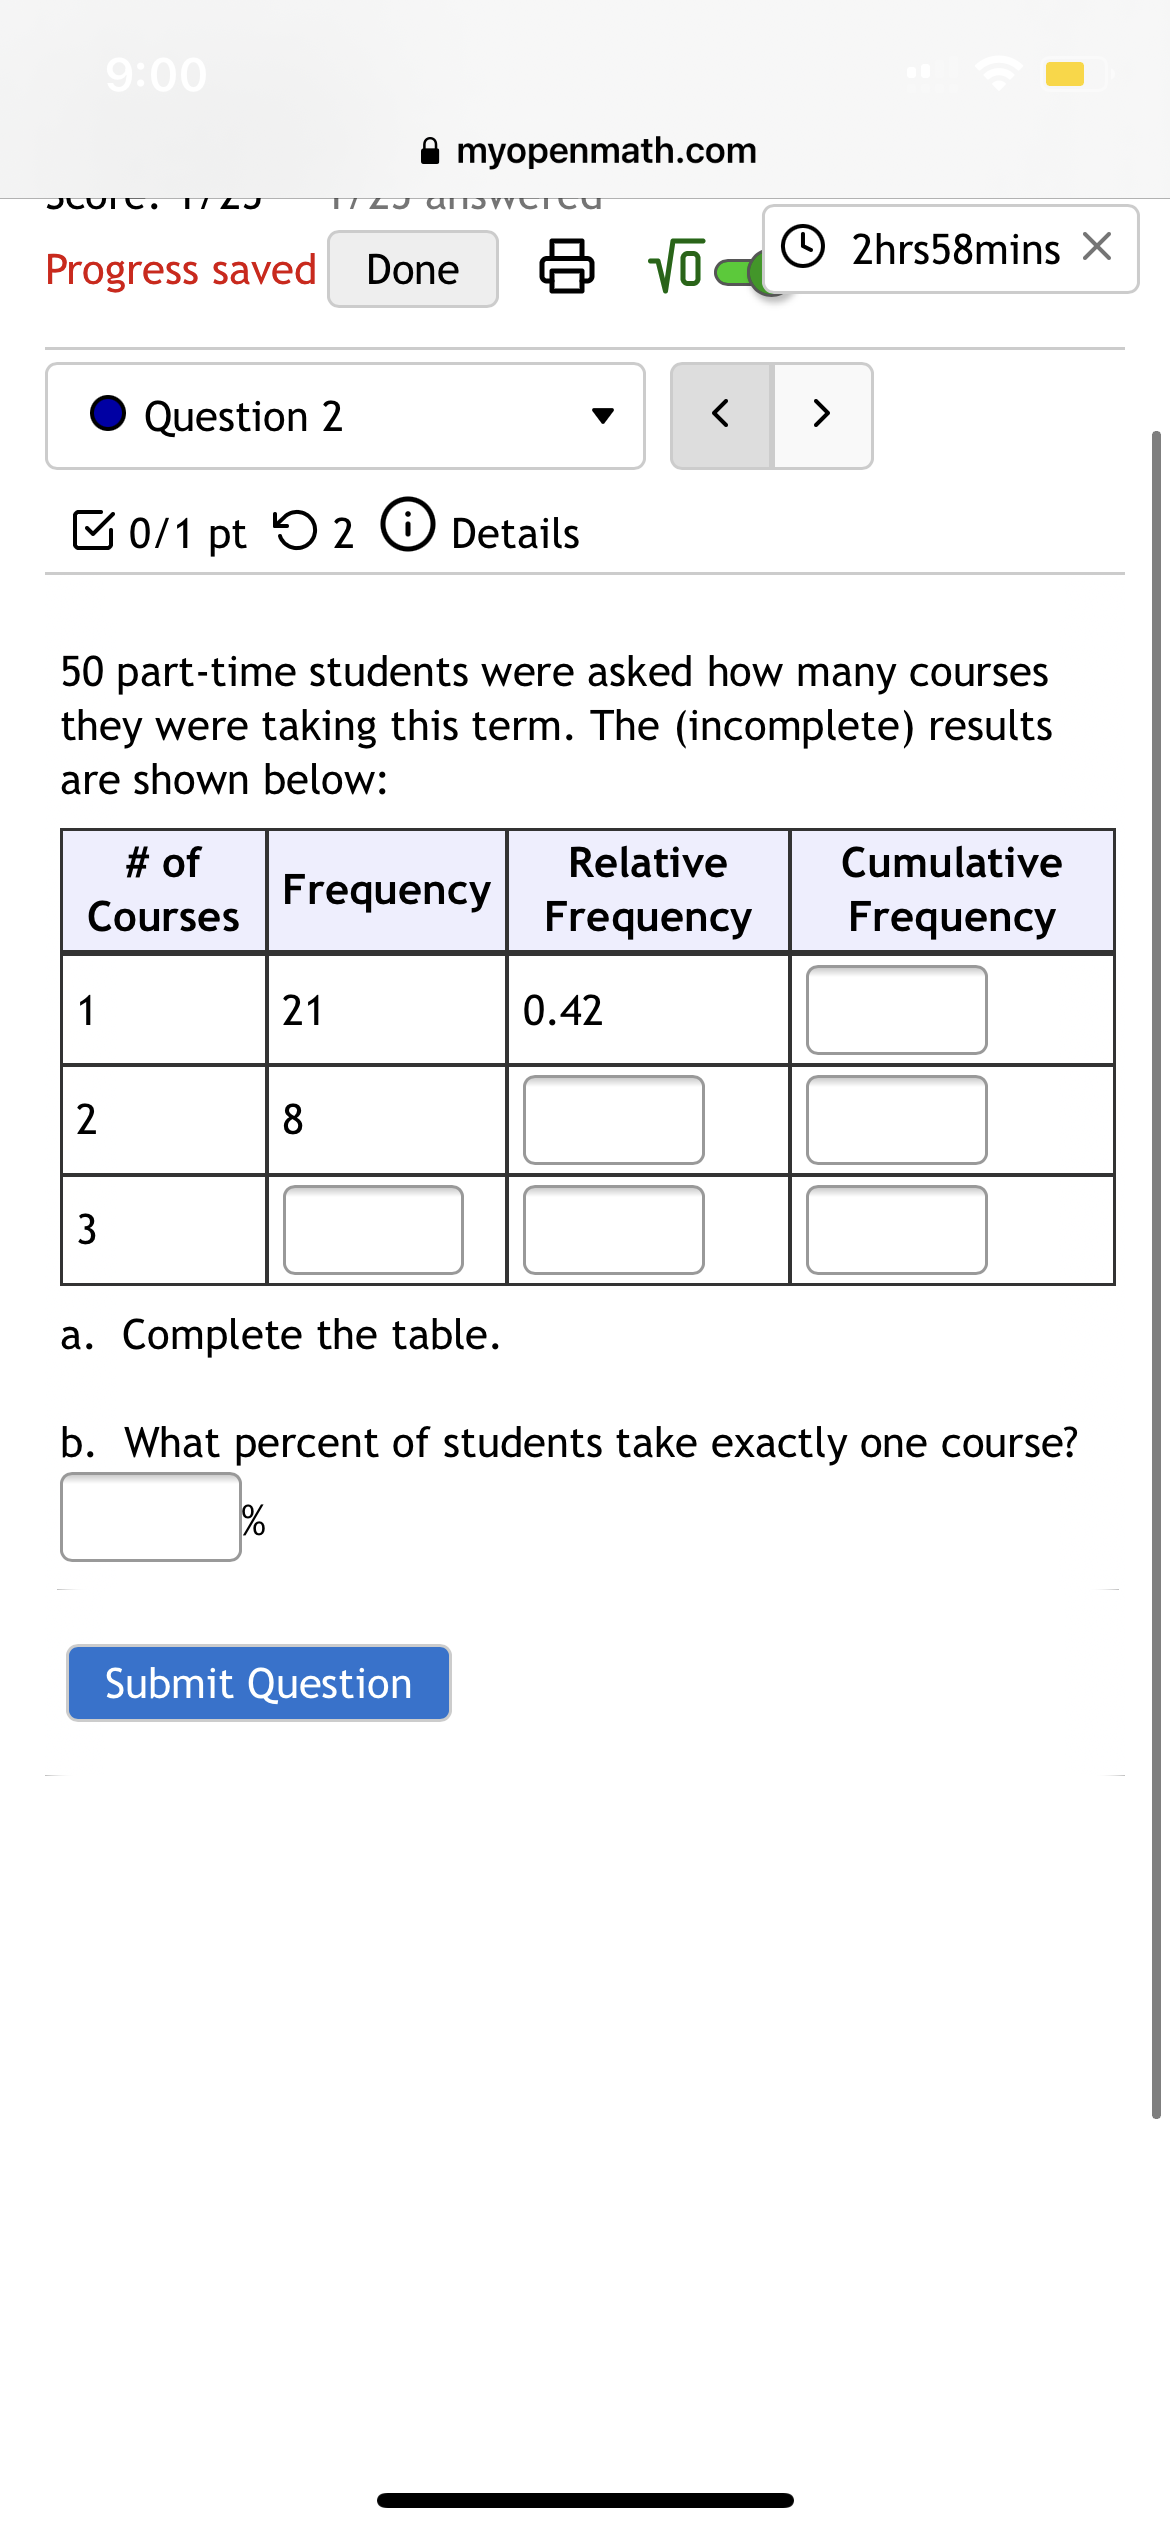
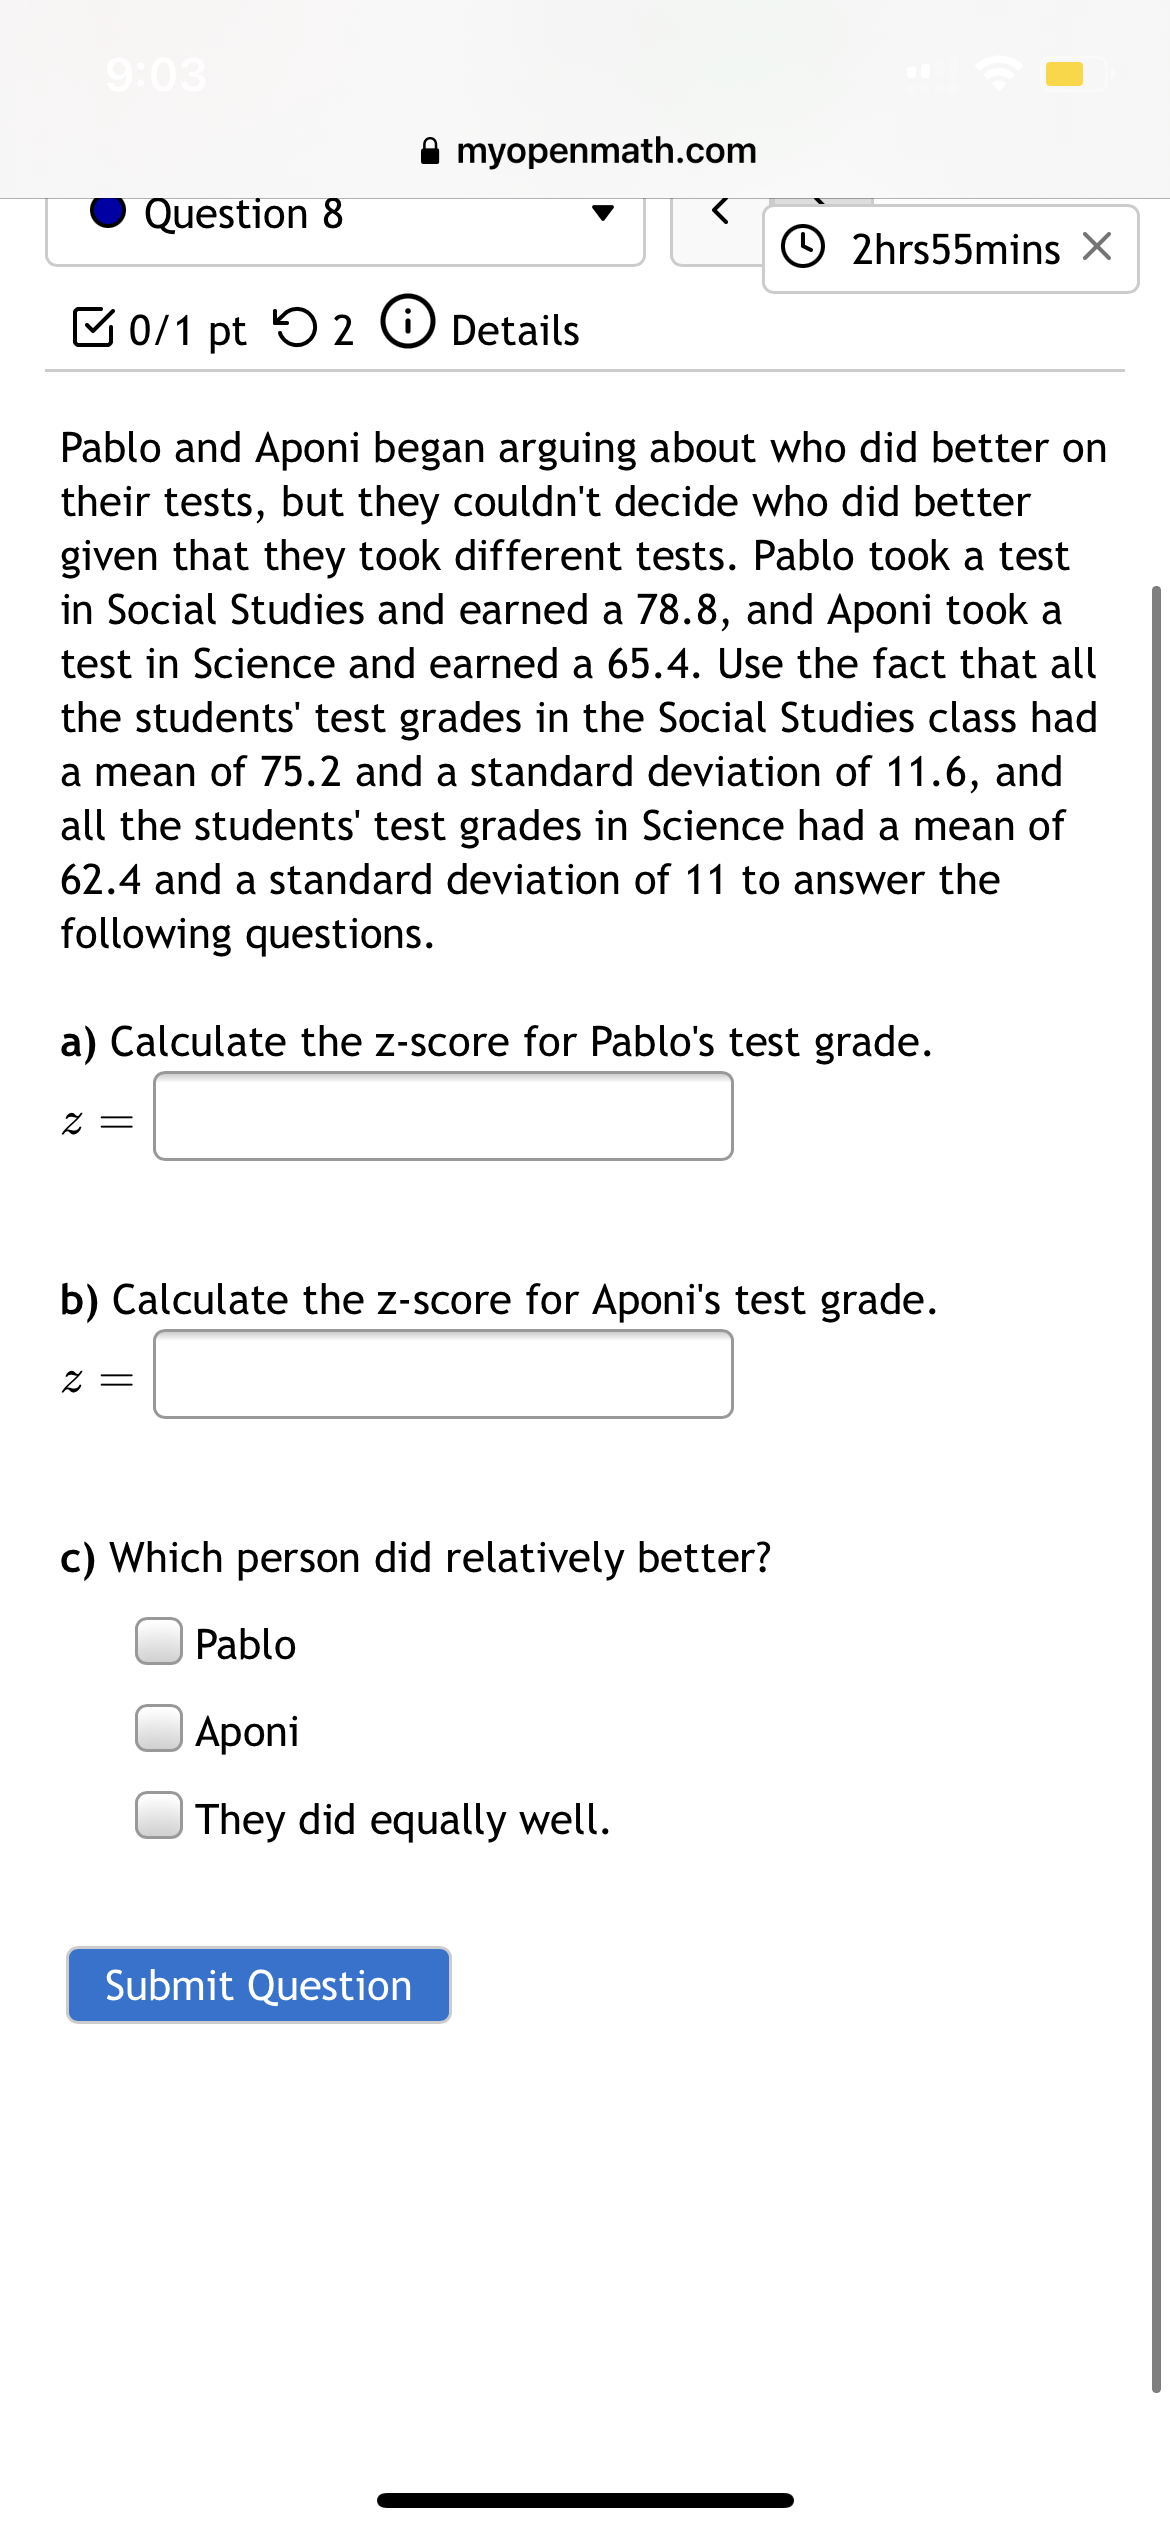
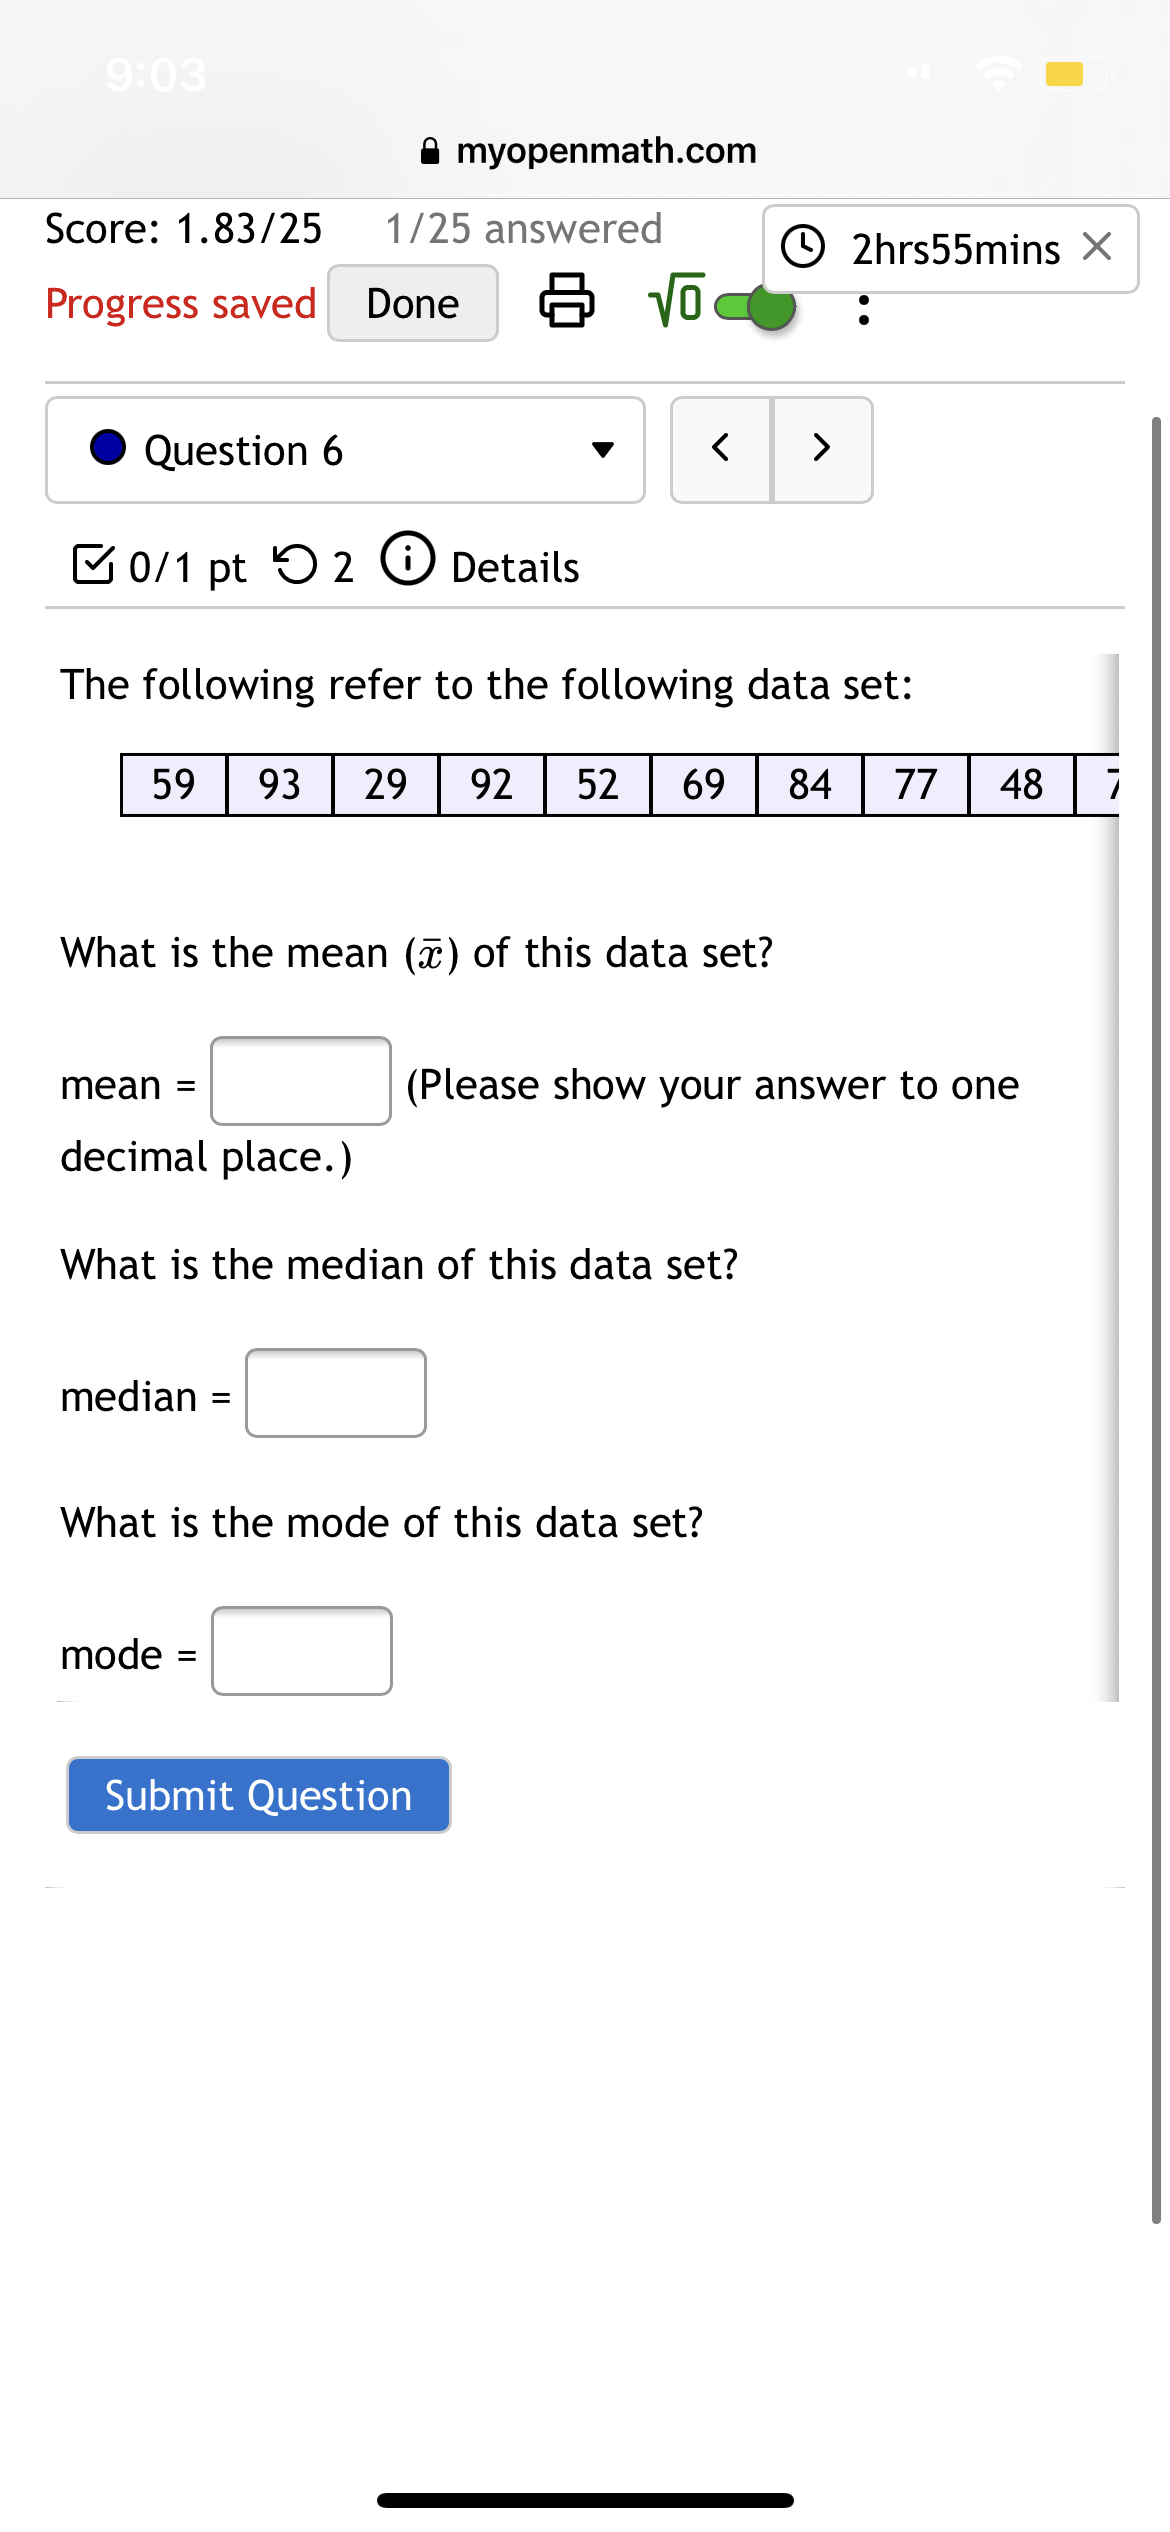
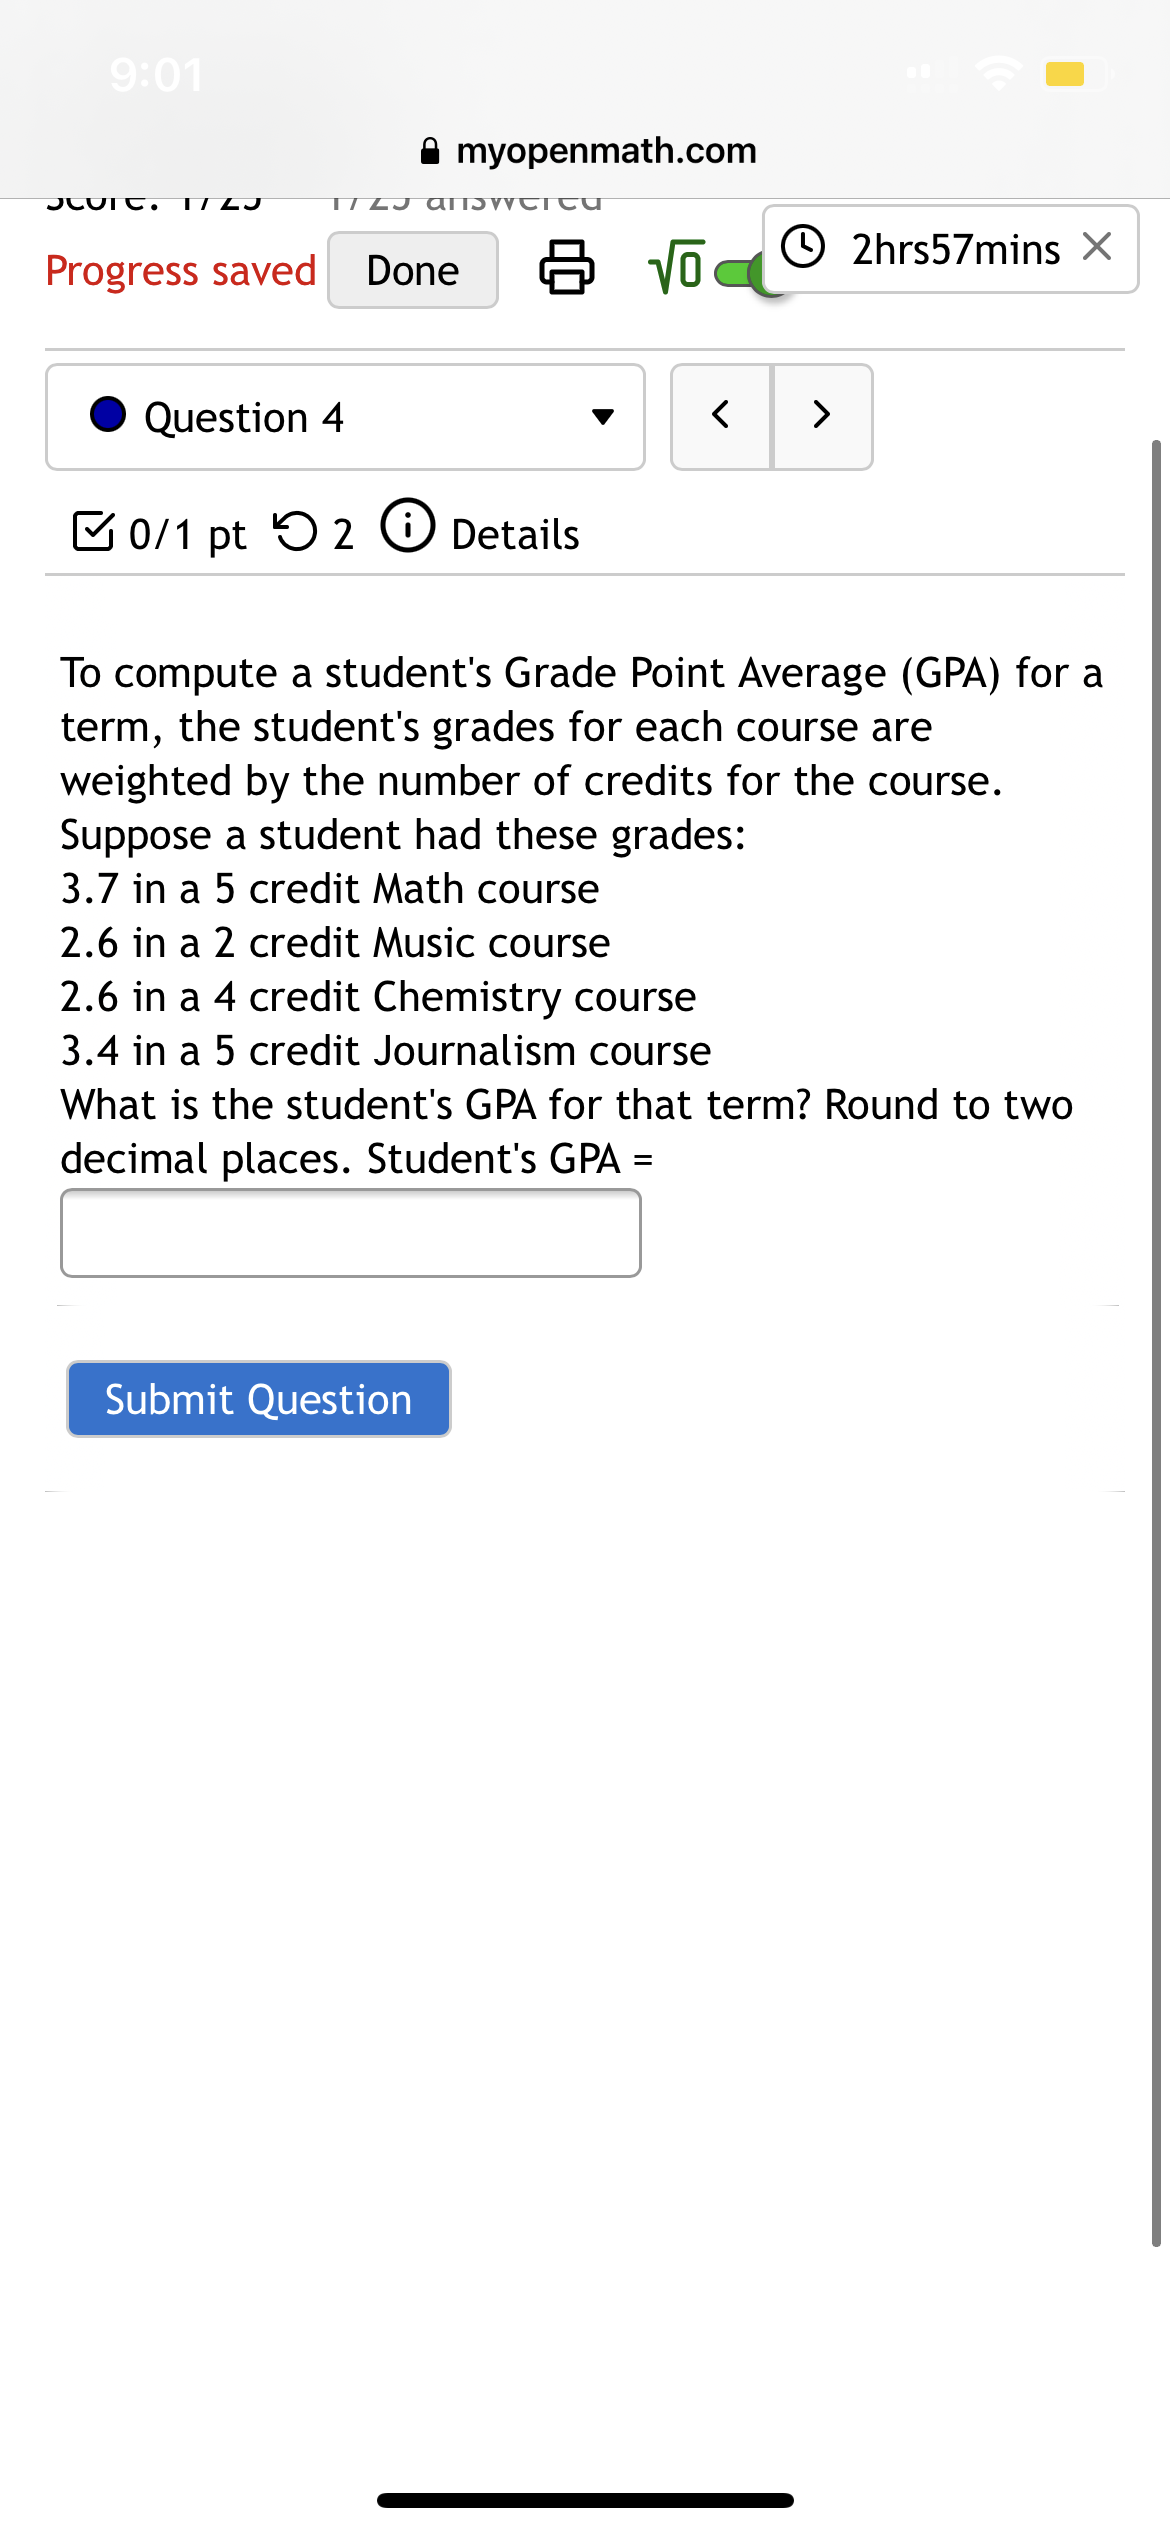
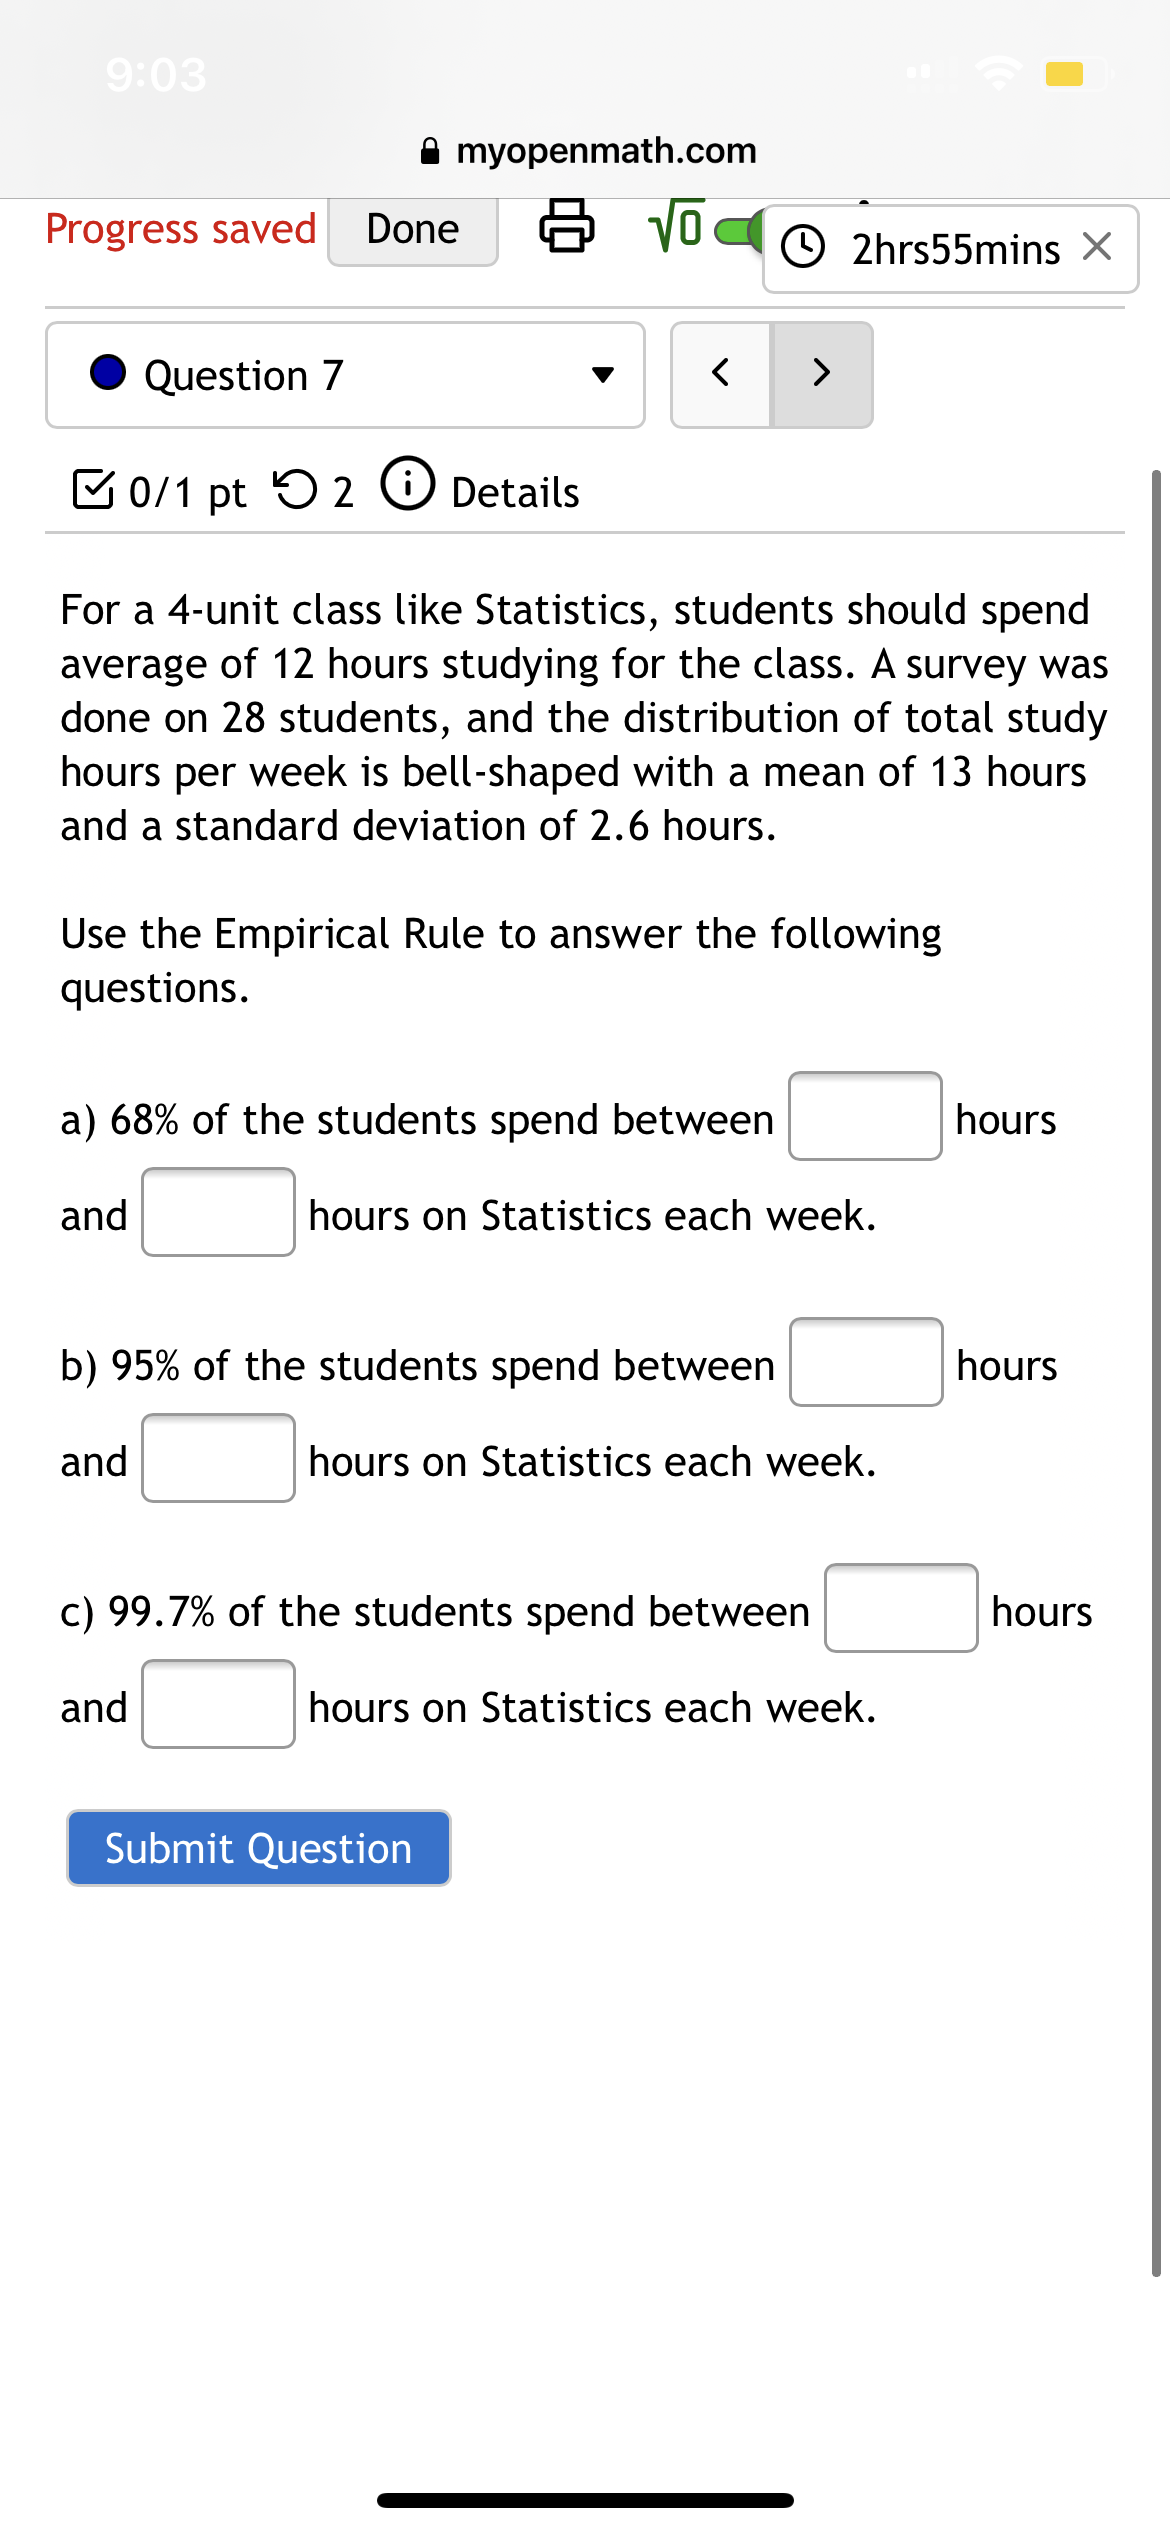


Done 3 myopenmath.com AA C C9 2hr555mins X 0 Question 9 v E 0/1 pt '0 2 6) Details To compute a student's Grade Point Average (GPA) for a term, the student's grades for each course are weighted by the number of credits for the course. Suppose a student had these grades: 3.7 in a 5 credit Math course 2.6 in a 2 credit Music course 2.6 in a 4 credit Chemistry course 3.4 in a 5 credit Journalism course What is the student's GPA for that term? Round to two decimal places. Student's GPA = i myopenmath.com Progress saved Done - (E) 1'6ng 2hr555mins X 0 Question 7 v E 0/1 pt '0 2 6) Details For a 4-unit class like Statistics, students should spend average of 12 hours studying for the class. A survey was done on 28 students, and the distribution of total study hours per week is bell-shaped with a mean of 13 hours and a standard deviation of 2.6 hours. Use the Empirical Rule to answer the following questions. a) 68% of the students spend between hours and hours on Statistics each week. b) 95% of the students spend between hours and hours on Statistics each week. c) 99.7% of the students spend between hours and hours on Statistics each week. Submit Question i myopenmath.com .Question15 V" 0/1 pt 1 2 0 Details 50 part-time students were asked how many courses they were taking this term. The (incomplete) results are shown below: # of Relative Cumulative Courses Frequency Frequency Frequency 21 0.42 2 8 3 a. Complete the table. b. What percent of students take exactly one course? Submit Question9:03 myopenmath.com Question 8 2hrs55mins X 0/1 pt 2 0 Details Pablo and Aponi began arguing about who did better on their tests, but they couldn't decide who did better given that they took different tests. Pablo took a test in Social Studies and earned a 78.8, and Aponi took a test in Science and earned a 65.4. Use the fact that all the students' test grades in the Social Studies class had a mean of 75.2 and a standard deviation of 11.6, and all the students' test grades in Science had a mean of 62.4 and a standard deviation of 11 to answer the following questions. a) Calculate the z-score for Pablo's test grade. 2 = b) Calculate the z-score for Aponi's test grade. 2 = c) Which person did relatively better? Pablo Aponi They did equally well. Submit
Step by Step Solution
There are 3 Steps involved in it

Get step-by-step solutions from verified subject matter experts