

Question: Dont forget to dot the dots drop down box 1 choice below, above, equal to drop down box 2 below, above, equal to drop down
Dont forget to dot the dots
drop down box 1 choice below, above, equal to
drop down box 2 below, above, equal to
drop down 3 fall, rise
drop down 4 AD, LRAS, SRAS
drop down 5 left, right
drop down 6 5,6,10 trillion
drop down 7 50,60,70
--------------------------------------------------------------------------------------------------------------------------------------------------------------------------------
drop down box 1 aggregate demand, aggregate supply
box 2 right,left
box 3 rise above, fall below
box 4 rise above, fall below
box 5 rise above, fall below
box 1 remain the same, adjust downward, adjust upward
box 2 short run aggregate supply, aggregate demand,
box 3 left, right
box 4 increase, decrease, remain the same
box 5 rises above, returns to, falls below
box 6 rises above, returns to, falls below
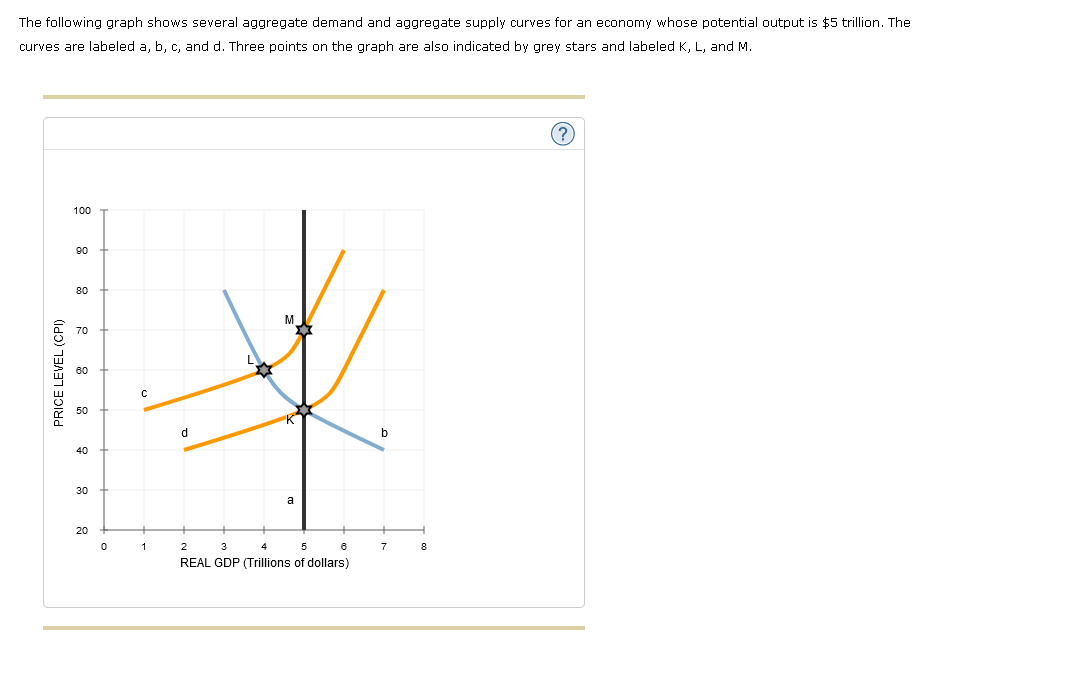
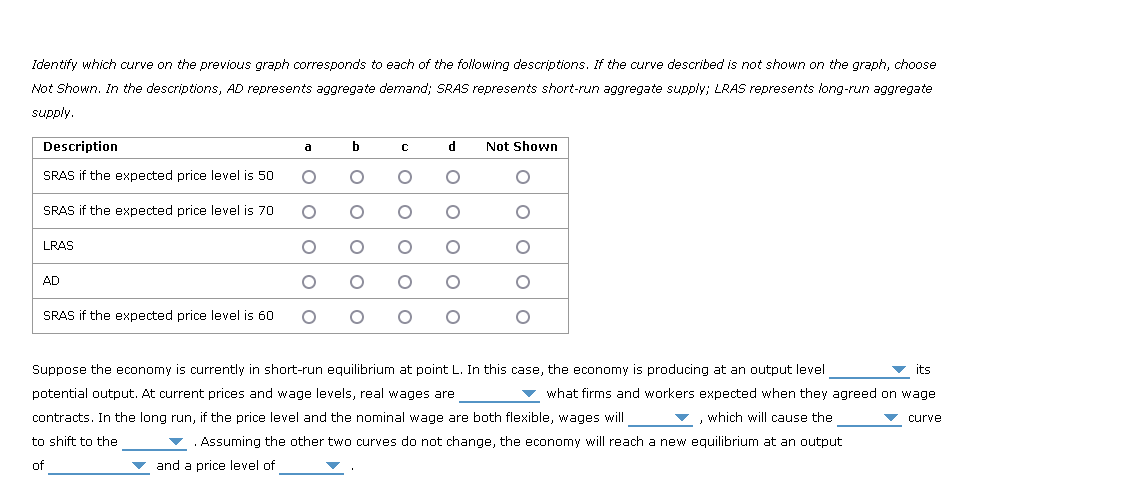
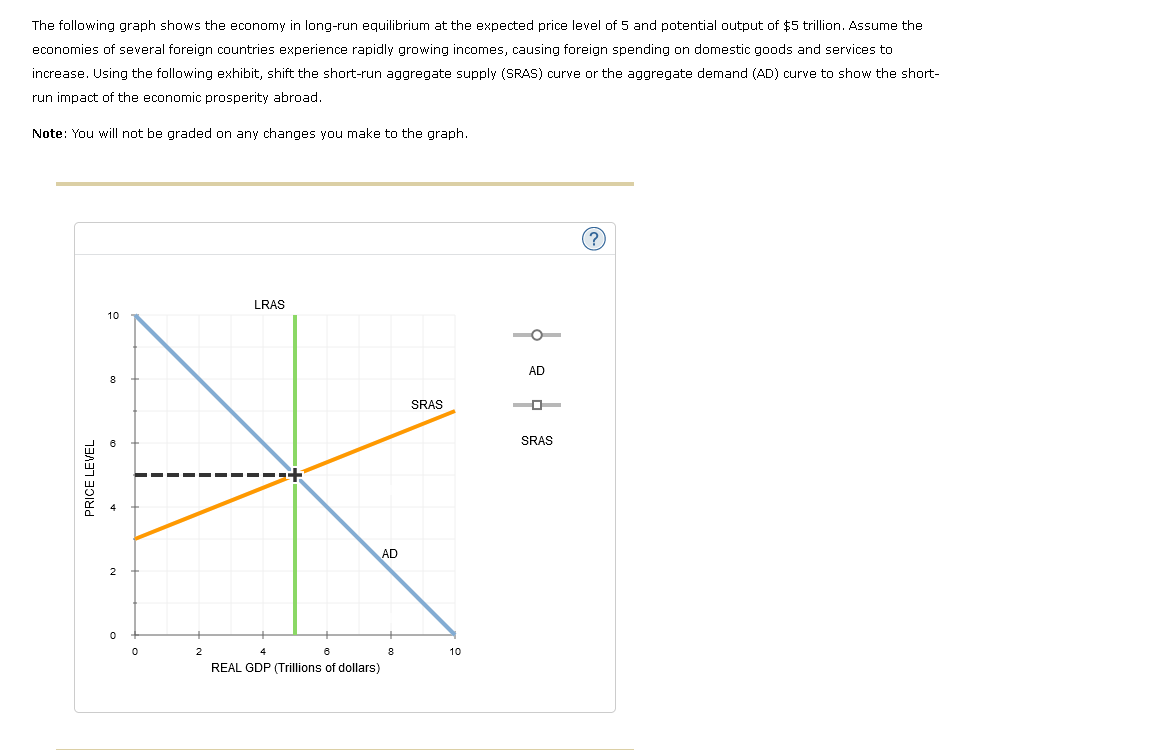
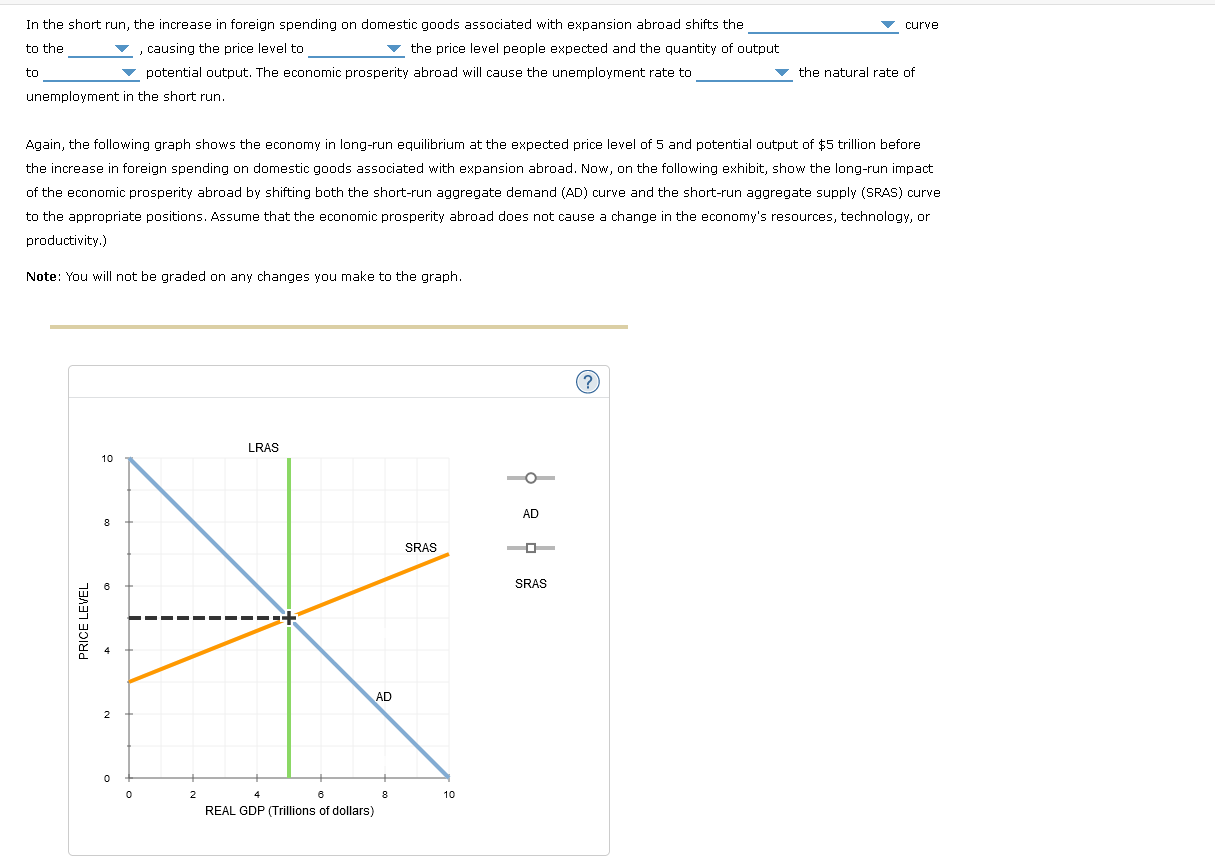
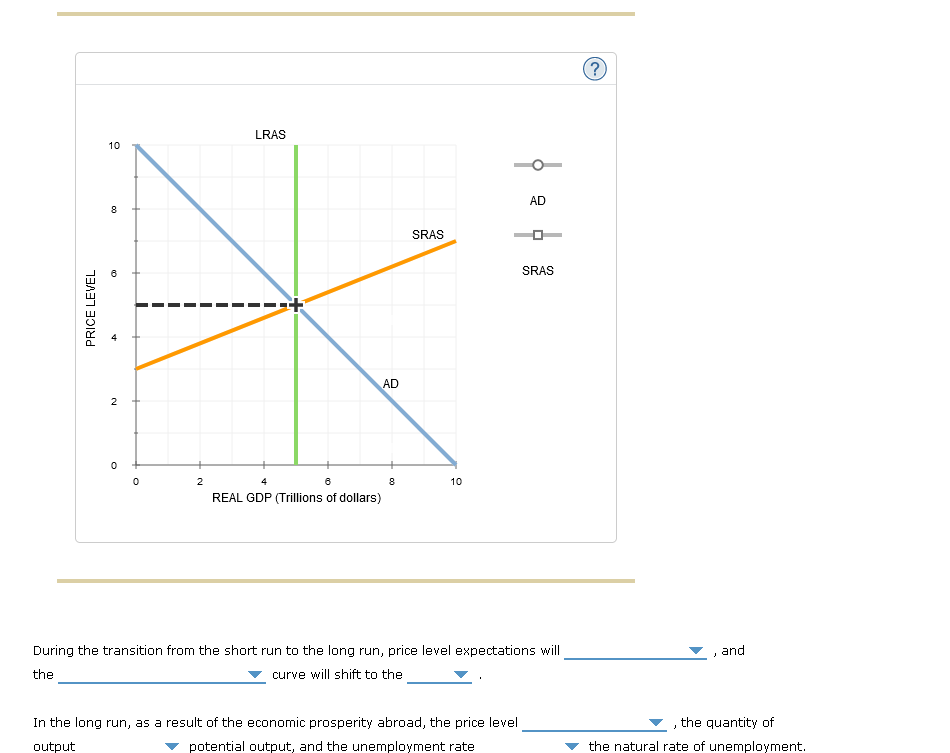
The following graph shows the economy in long-run equilibrium at the expected price level of 5 and potential output of $5 trillion. Assume the economies of several foreign countries experience rapidly growing incomes, causing foreign spending on domestic goods and services to increase. Using the following exhibit, shift the short-run aggregate supply (SRAS) curve or the aggregate demand (AD) curve to show the shortrun impact of the economic prosperity abroad. Note: You will not be graded on any changes you make to the graph. During the transition from the short run to the long run, price level expectations will , and the curve will shift to the In the long run, as a result of the economic prosperity abroad, the price level , the quantity of out sotential output, and the unemployment rate the natural rate of unemploymen The following graph shows several aggregate demand and aggregate supply curves for an economy whose potential output is $5 trillion. The curves are labeled a,b,c, and d. Three points on the graph are also indicated by grey stars and labeled K, L, and M. In the short run, the increase in foreign spending on domestic goods associated with expansion abroad shifts the curve to the , causing the price level to the price level people expected and the quantity of output to potential output. The economic prosperity abroad will cause the unemployment rate to the natural rate of unemployment in the short run. Again, the following graph shows the economy in long-run equilibrium at the expected price level of 5 and potential output of $5 trillion before the increase in foreign spending on domestic goods associated with expansion abroad. Now, on the following exhibit, show the long-run impact of the economic prosperity abroad by shifting both the short-run aggregate demand (AD) curve and the short-run aggregate supply (SRAS) curve to the appropriate positions. Assume that the economic prosperity abroad does not cause a change in the economy's resources, technology, or productivity.) Note: You will not be graded on any changes you make to the graph. Identify which curve on the previous graph corresponds to each of the following descriptions. If the curve described is not shown on the graph, choose Not Shown. In the descriptions, AD represents aggregate demand; SRAS represents short-run aggregate supply; LRAS represents long-run aggregate supply. Suppose the economy is currently in short-run equilibrium at point L. In this case, the economy is producing at an output level its potential output. At current prices and wage levels, real wages are what firms and workers expected when they agreed on wage contracts. In the long run, if the price level and the nominal wage are both flexible, wages will , which will cause the curve to shift to the . Assuming the other two curves do not change, the economy will reach a new equilibrium at an output of and a price level of
Step by Step Solution
There are 3 Steps involved in it

Get step-by-step solutions from verified subject matter experts