

Question: Don't need graph for (b) 5. . Studying the Temperature Dependence of the Rate Constant (k). The following reaction is studied at 3 different temperatures.
Don't need graph for (b)
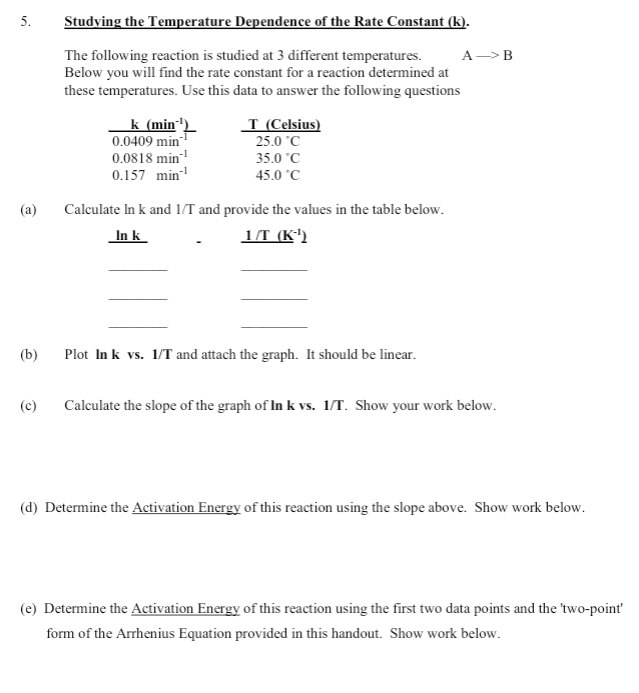
5. . Studying the Temperature Dependence of the Rate Constant (k). The following reaction is studied at 3 different temperatures. A->B Below you will find the rate constant for a reaction determined at these temperatures. Use this data to answer the following questions k (min' I (Celsius) 0.0409 min 25.0 C 0.0818 min 35.0C 0.157 min 45.0 C Calculate In k and 1/T and provide the values in the table below. In k 1/T (K) (a) (b) Plot Ink vs. 1/T and attach the graph. It should be linear. c) Calculate the slope of the graph of In k vs. 1/1. Show your work below. (d) Determine the Activation Energy of this reaction using the slope above. Show work below. (e) Determine the Activation Energy of this reaction using the first two data points and the 'two-point' form of the Arrhenius Equation provided in this handout. Show work below
Step by Step Solution
There are 3 Steps involved in it

Get step-by-step solutions from verified subject matter experts