

Question: Don't need to explain it ! Use the Descriptive Statistics feature to obtain the summary statistics of day 1-19 and then day 20-39 for each

Don't need to explain it !
Use the Descriptive Statistics feature to obtain the summary statistics of day 1-19 and then day 20-39 for each courier. Compare the statistics and comment. Did the couriers indeed take longer for them to deliver the documents over time?
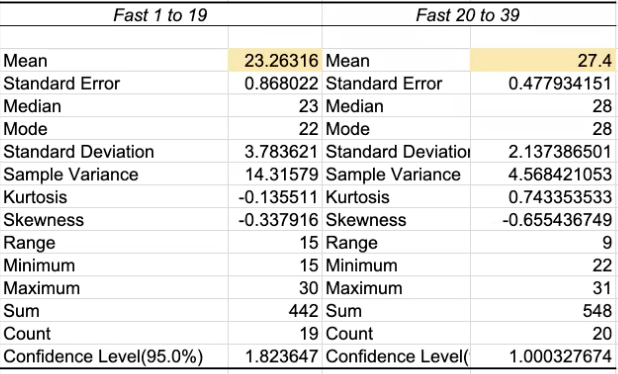
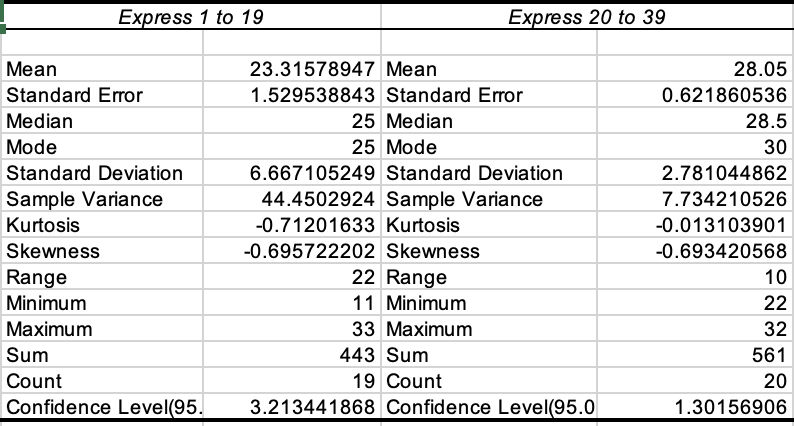
Fast 1 to 19 Fast 20 to 39 Mean 23.26316 Mean 27.4 Standard Error 0.868022 Standard Error 0.477934151 Median 23 Median 28 Mode 22 Mode 28 Standard Deviation 3.783621 Standard Deviation 2.137386501 Sample Variance 14.31579 Sample Variance 4.568421053 Kurtosis -0. 135511 Kurtosis 0.743353533 Skewness -0.337916 Skewness -0.655436749 Range 15 Range 9 Minimum 15 Minimum 22 Maximum 30 Maximum 31 Sum 442 Sum 548 Count 19 Count 20 Confidence Level(95.0%) 1.823647 Confidence Level( 1.000327674Express 1 to 19 Express 20 to 39 Mean 23.31578947 Mean 28.05 Standard Error 1.529538843 Standard Error 0.621860536 Median 25 Median 28.5 Mode 25 Mode 30 Standard Deviation 6.667105249 Standard Deviation 2.781044862 Sample Variance 44.4502924 Sample Variance 7.734210526 Kurtosis -0.71201633 Kurtosis -0.013103901 Skewness -0.695722202 Skewness -0.693420568 Range 22 Range 10 Minimum 11 Minimum 22 Maximum 33 Maximum 32 Sum 443 Sum 561 Count 19 Count 20 Confidence Level(95. 3.213441868 Confidence Level(95.0 1.30156906
Step by Step Solution
There are 3 Steps involved in it

Get step-by-step solutions from verified subject matter experts