

Question: dont use excel explain the solution pls 1. The 6 months aggregate demand forecasts for a product group produced by XYZ Company are given the
dont use excel explain the solution pls
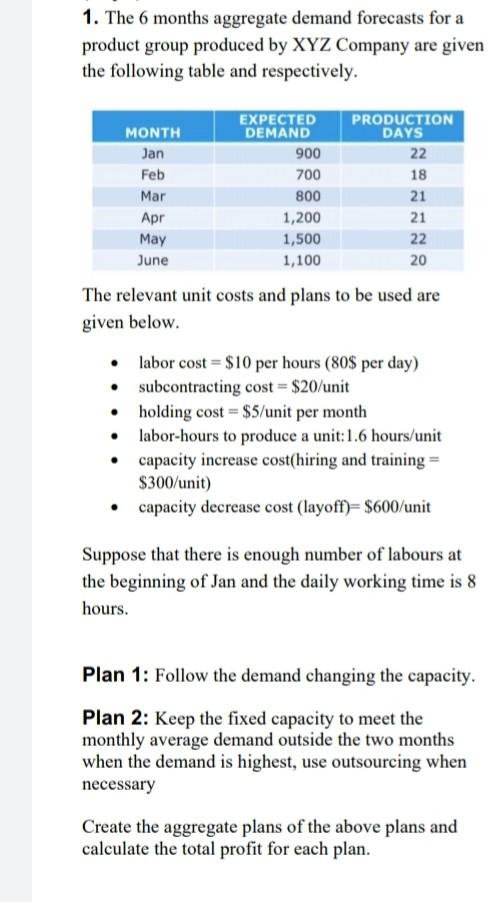
1. The 6 months aggregate demand forecasts for a product group produced by XYZ Company are given the following table and respectively. EXPECTED PRODUCTION MONTH DEMAND DAYS Jan 900 22 Feb 700 18 Mar 800 21 Apr 1,200 21 May 1,500 June 1,100 20 The relevant unit costs and plans to be used are given below. 22 labor cost = $10 per hours (80$ per day) subcontracting cost = $20/unit holding cost = $5/unit per month labor-hours to produce a unit:1.6 hours/unit capacity increase cost(hiring and training = $300/unit) capacity decrease cost (layoff)= $600/unit Suppose that there is enough number of labours at the beginning of Jan and the daily working time is 8 hours. Plan 1: Follow the demand changing the capacity. Plan 2: Keep the fixed capacity to meet the monthly average demand outside the two months when the demand is highest, use outsourcing when necessary Create the aggregate plans of the above plans and calculate the total profit for each planStep by Step Solution
There are 3 Steps involved in it
1 Expert Approved Answer
Step: 1 Unlock

Question Has Been Solved by an Expert!
Get step-by-step solutions from verified subject matter experts
Step: 2 Unlock
Step: 3 Unlock