

Question: don't use excel or other programs, want all explanations! QUESTION 5 (25 points): A professor of statistics is interested in studying the relationship between the
don't use excel or other programs, want all explanations!
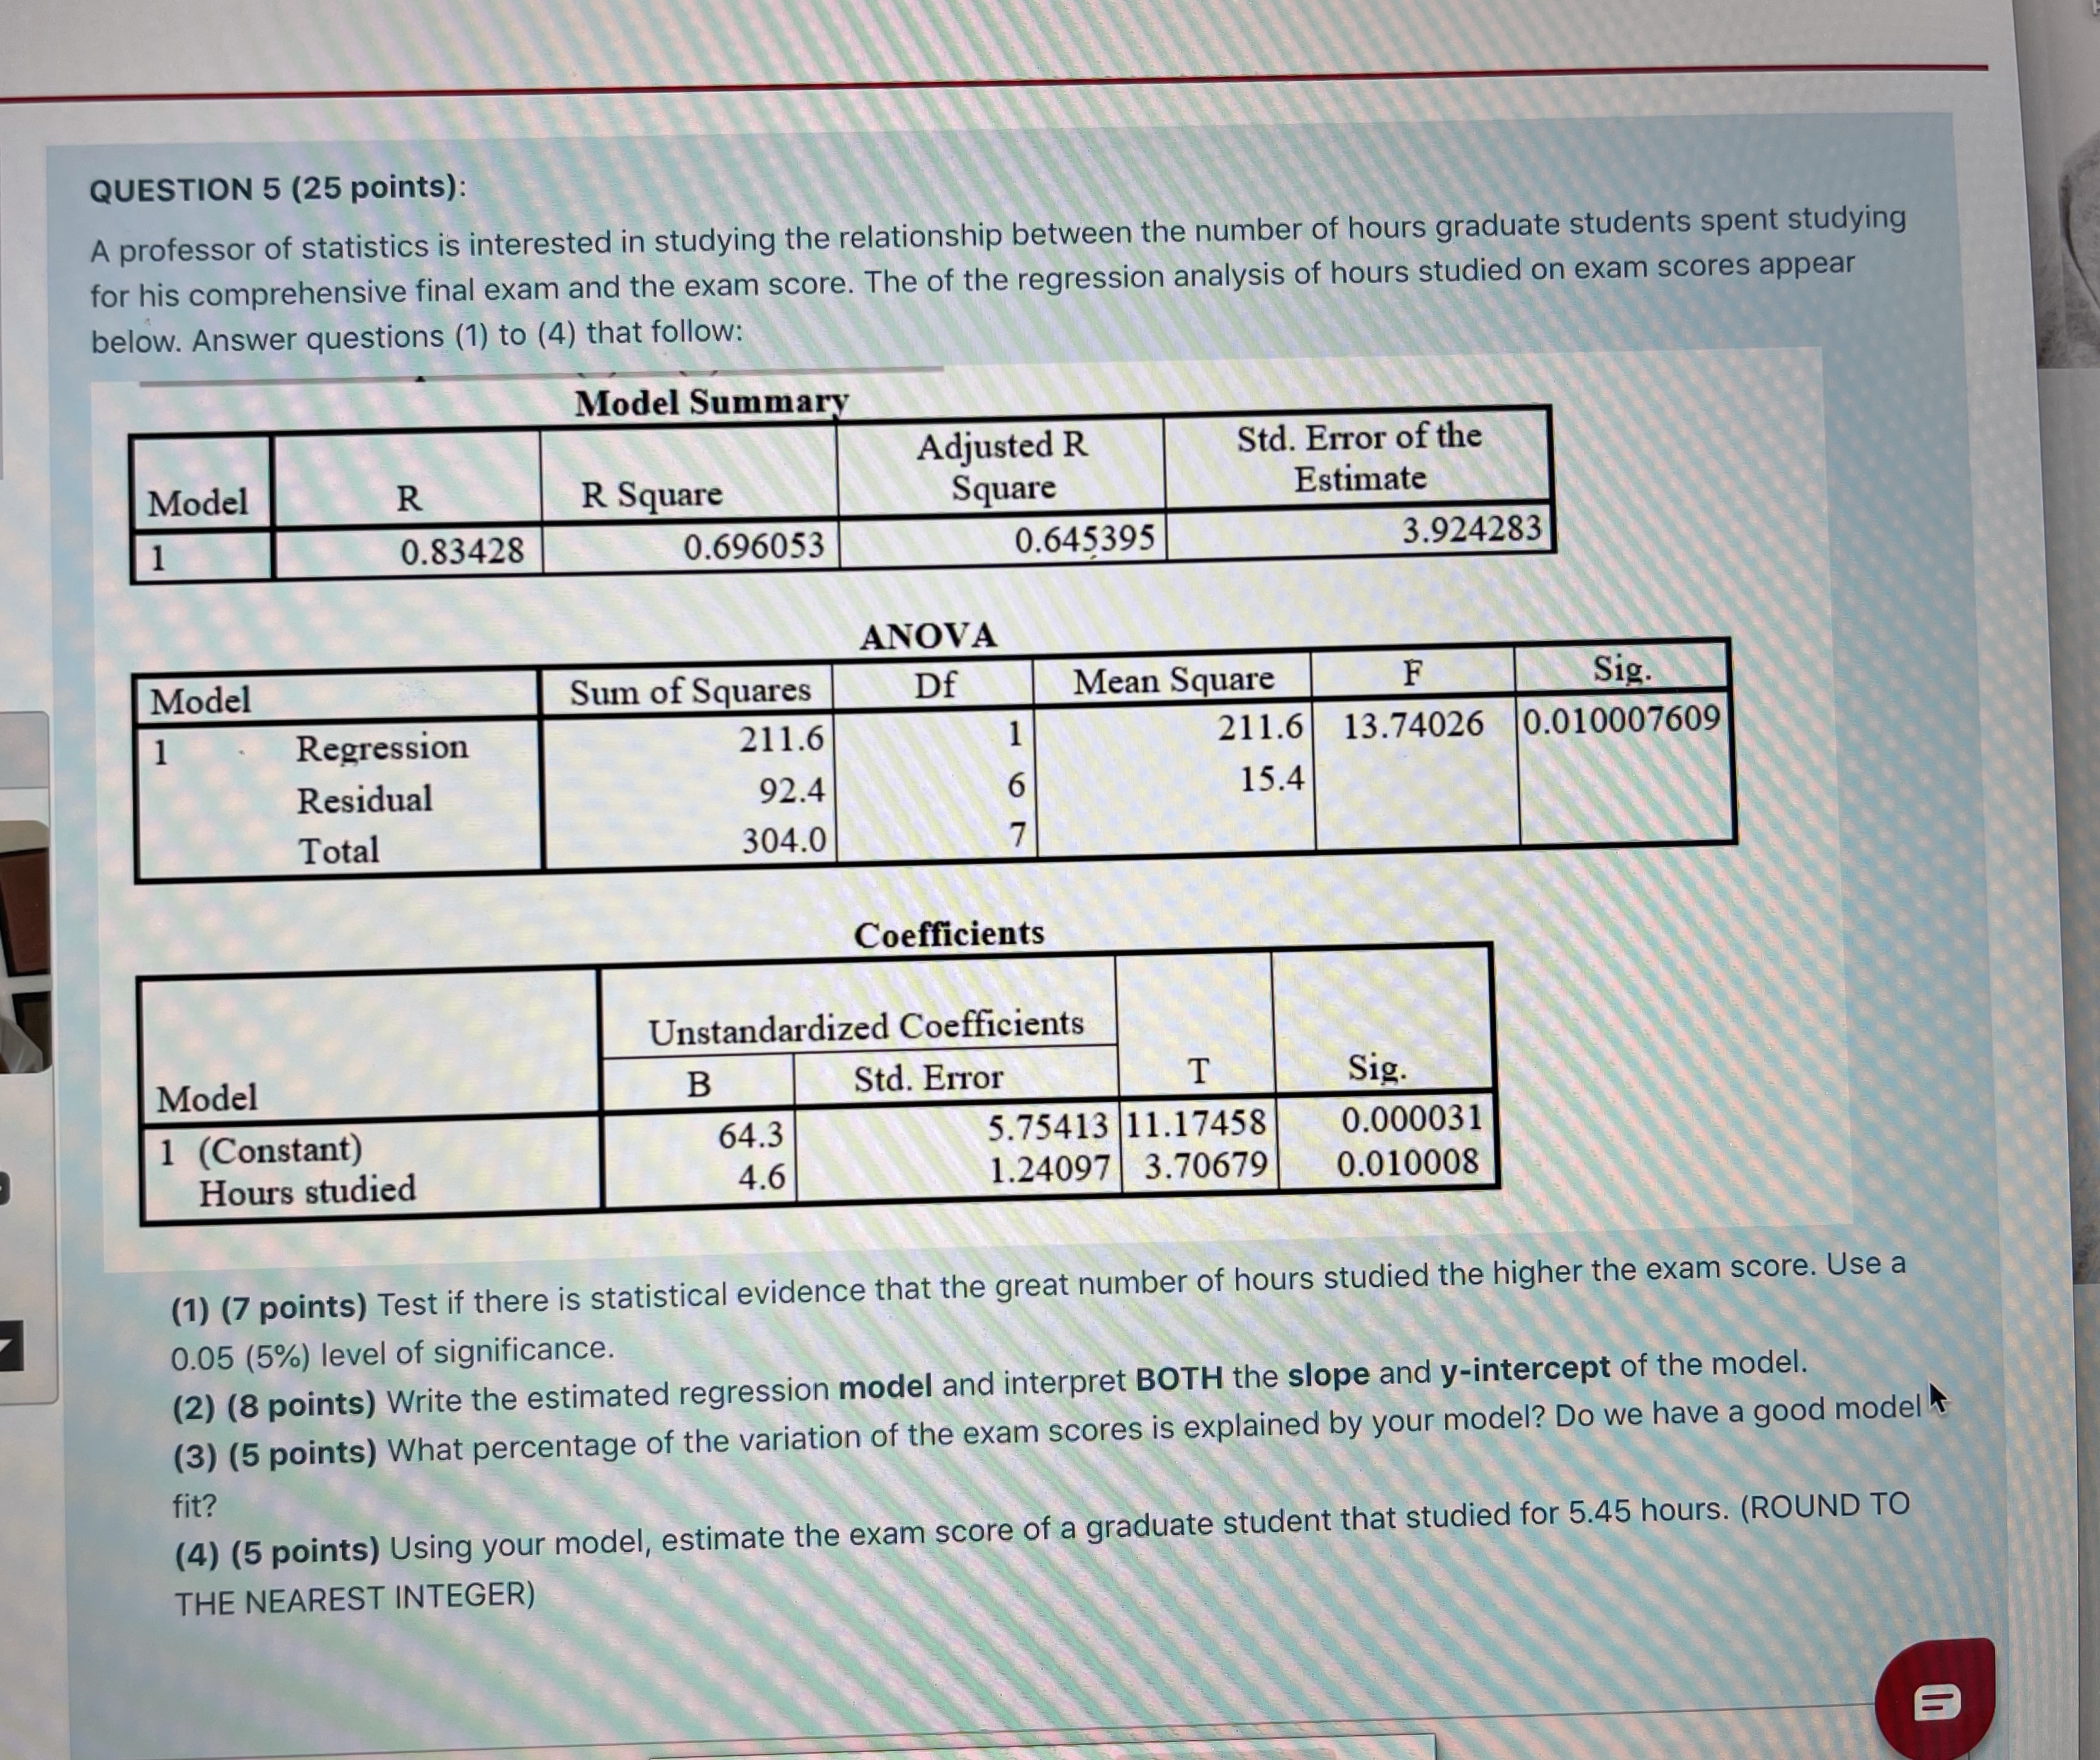
QUESTION 5 (25 points): A professor of statistics is interested in studying the relationship between the number of hours graduate students spent studying for his comprehensive final exam and the exam score. The of the regression analysis of hours studied on exam scores appear below. Answer questions (1) to (4) that follow: Model Summary Adjusted R Std. Error of the Model R R Square Square Estimate 0.83428 0.696053 0.645395 3.924283 ANOVA Model Sum of Squares Df Mean Square F Sig Regression 211.6 211.6 13.74026 0.010007609 Residual 92.4 15.4 Total 304.0 Coefficients Unstandardized Coefficients Model B Std. Error T Sig. 1 (Constant) 64.3 5.75413 11.17458 0.000031 Hours studied 4.6 1.24097 3.70679 0.010008 (1) (7 points) Test if there is statistical evidence that the great number of hours studied the higher the exam score. Use a 0.05 (5%) level of significance. (2) (8 points) Write the estimated regression model and interpret BOTH the slope and y-intercept of the model. (3) (5 points) What percentage of the variation of the exam scores is explained by your model? Do we have a good model fit ? (4) (5 points) Using your model, estimate the exam score of a graduate student that studied for 5.45 hours. (ROUND TO THE NEAREST INTEGER)
Step by Step Solution
There are 3 Steps involved in it

Get step-by-step solutions from verified subject matter experts