

Question: Doro inputs: Expected unit sales 40,000 Selling price per unit 5 12,50 Variable expense per unit 5 7.50 Total xed expenses 5 180,000 Contribution Format
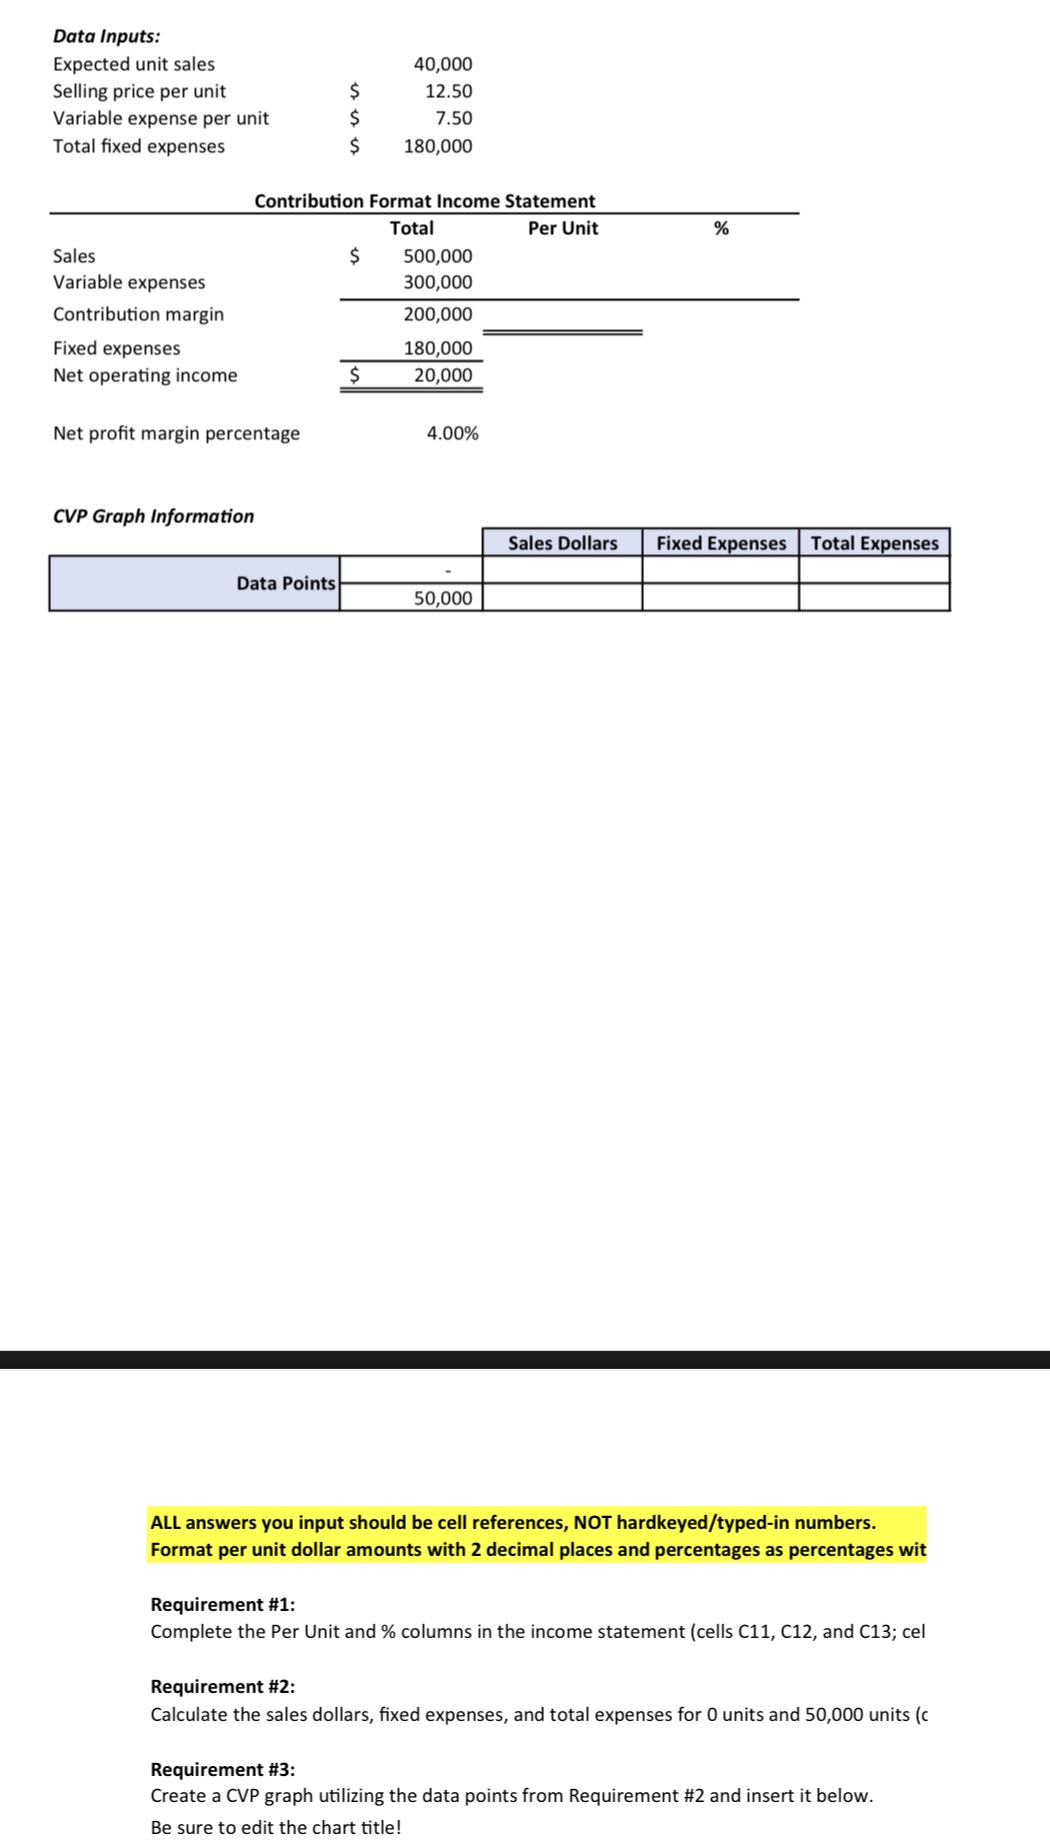
Doro inputs: Expected unit sales 40,000 Selling price per unit 5 12,50 Variable expense per unit 5 7.50 Total xed expenses 5 180,000 Contribution Format Income Statement Total Per Unit 96 Sales 5 500,000 Variable expenses 300,000 Contribution margin 200,000 Fixed expenses 180,000 Net operating income 3 20,000 Net prot margin percentage 400% CVP Graph information Sales Dollars mm Data Points _ 501000 ALE. answers you input should be cell references, NOT hardkeved/typed-in numbers. Format per unit dollar amounts with 2 decimal places and percentages as percentages wit Requirement #1: Complete the Per Unit and 96 columns in the income statement (cells C11, C12, and C13; ceI Requirement #2: Calculate the sales dollars, xed expenses, and total expenses for 0 units and 50,000 units (( Requirement #3: Create a CVP graph utilizing the data points from Requirement #2 and insert it below. Be sure to edit the chart title
Step by Step Solution
There are 3 Steps involved in it

Get step-by-step solutions from verified subject matter experts