

Question: Dot plots 2. Answer the following questions based on the dot plot below. 2 3 5 Number of pets at home a) What is the
Dot plots
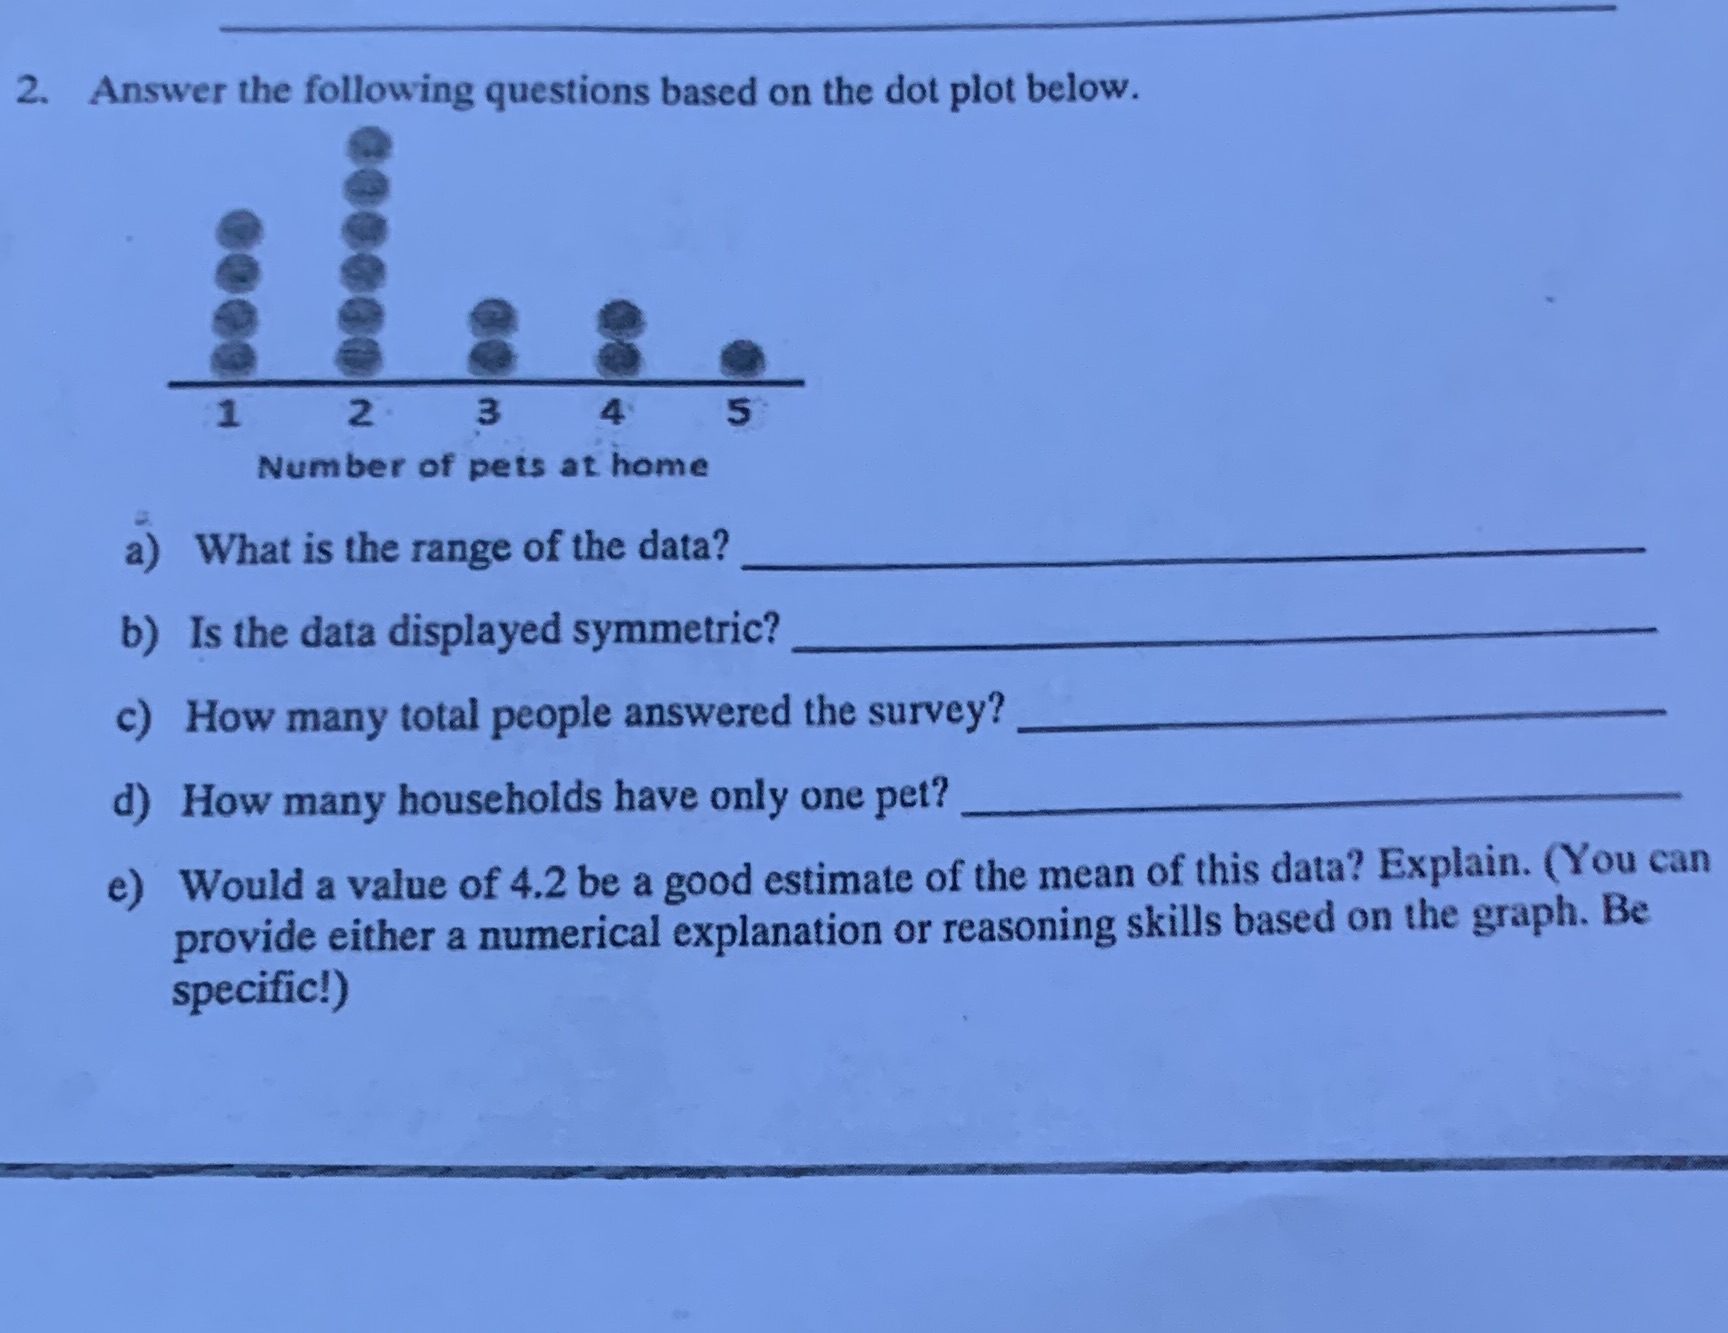
2. Answer the following questions based on the dot plot below. 2 3 5 Number of pets at home a) What is the range of the data? b) Is the data displayed symmetric? c) How many total people answered the survey? d) How many households have only one pet? e) Would a value of 4.2 be a good estimate of the mean of this data? Explain. (You can provide either a numerical explanation or reasoning skills based on the graph. Be specific!)
Step by Step Solution
There are 3 Steps involved in it
1 Expert Approved Answer
Step: 1 Unlock

Question Has Been Solved by an Expert!
Get step-by-step solutions from verified subject matter experts
Step: 2 Unlock
Step: 3 Unlock