

Question: Download the Excel data file and complete the questions below. Keeping track of production quantities and costs is a natural part of a company's work.
Download the Excel data file and complete the questions below.
Keeping track of production quantities and costs is a natural part of a company's work. Estimating costs for the next period based on
activity and costs from prior periods is also common practice. Data visualizations can provide a unique perspective in the analysis of
these costs over time.
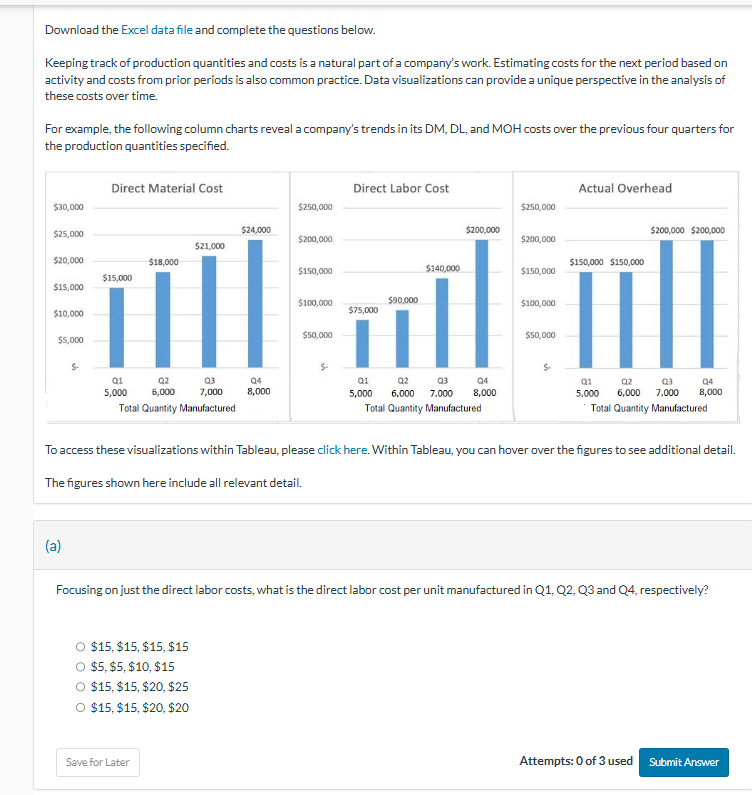
For example, the following column charts reveal a company's trends in its DM DL and MOH costs over the previous four quarters for
the production quantities specified.
To access these visualizations within Tableau, please click here. Within Tableau, you can hover over the figures to see additional detail.
The figures shown here include all relevant detail.
a
Focusing on just the direct labor costs, what is the direct labor cost per unit manufactured in and Q respectively?
$$$$
$$$$
$$$$
$$$$
Step by Step Solution
There are 3 Steps involved in it
1 Expert Approved Answer
Step: 1 Unlock

Question Has Been Solved by an Expert!
Get step-by-step solutions from verified subject matter experts
Step: 2 Unlock
Step: 3 Unlock