

Question: Draw a curve for the temperature distribution for smooth base plate and finned base plate to show the temperature profile and the temperature drop when
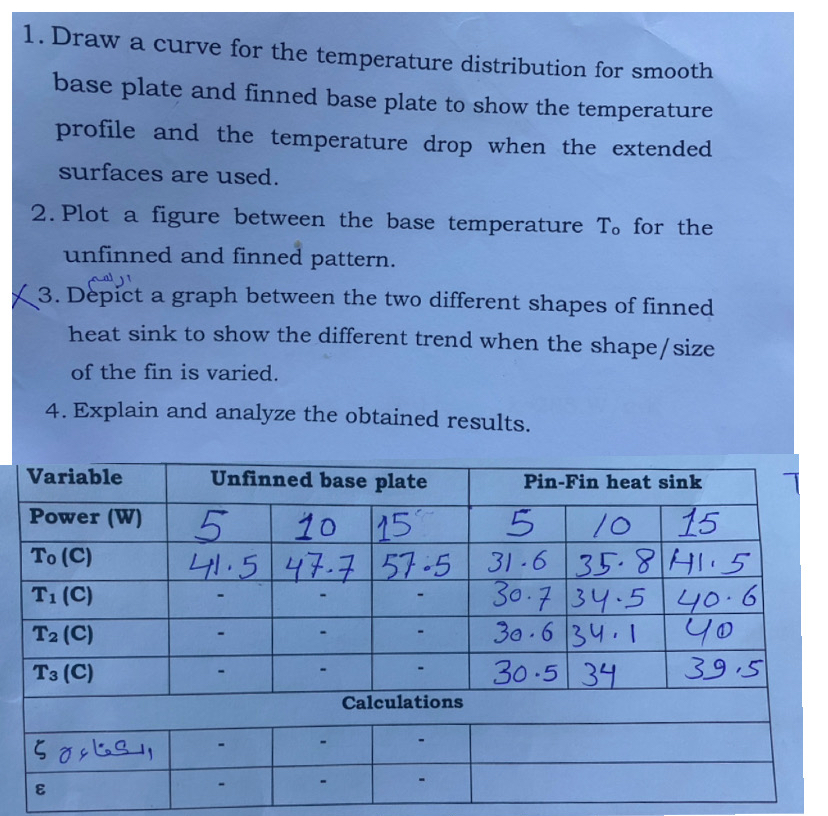
Draw a curve for the temperature distribution for smooth base plate and finned base plate to show the temperature profile and the temperature drop when the extended surfaces are used.
Plot a figure between the base temperature for the unfinned and finned pattern.
Depict a graph between the two different shapes of finned heat sink to show the different trend when the shapesize of the fin is varied.
Explain and analyze the obtained results.
Step by Step Solution
There are 3 Steps involved in it
1 Expert Approved Answer
Step: 1 Unlock

Question Has Been Solved by an Expert!
Get step-by-step solutions from verified subject matter experts
Step: 2 Unlock
Step: 3 Unlock