

Question: Draw a data visual for the attached data set: What do you do when you're bored?. Here are the most common responses by age group.
Draw a data visual for the attached data set:
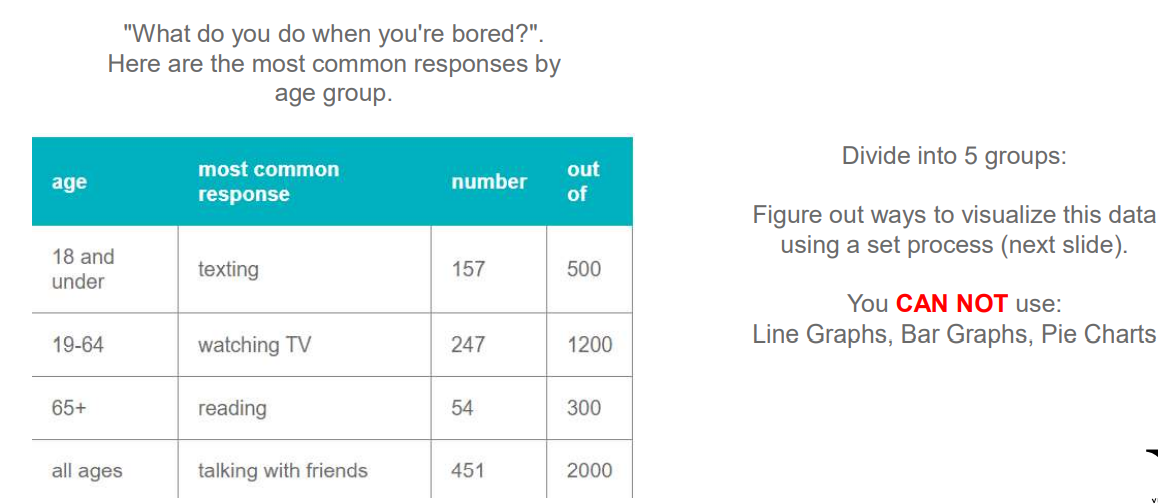
"What do you do when you're bored?". Here are the most common responses by age group. most common response 18 and under 157 texting 19-64 watching TV 247 1200 65+ reading 54 300 all ages talking with friends 451 2000 Divide into 5 groups: Figure out ways to visualize this data using a set process (next slide). You CAN NOT use: Line Graphs, Bar Graphs, Pie Charts
Step by Step Solution
There are 3 Steps involved in it
1 Expert Approved Answer
Step: 1 Unlock

Question Has Been Solved by an Expert!
Get step-by-step solutions from verified subject matter experts
Step: 2 Unlock
Step: 3 Unlock