

Question: Draw a flowchart for the following objective. There are usually several ways to complete a GIS model. Diagram the most efficient process to achieve the
Draw a flowchart for the following objective. There are usually several ways to complete a GIS model. Diagram the most efficient process to achieve the stated objective.
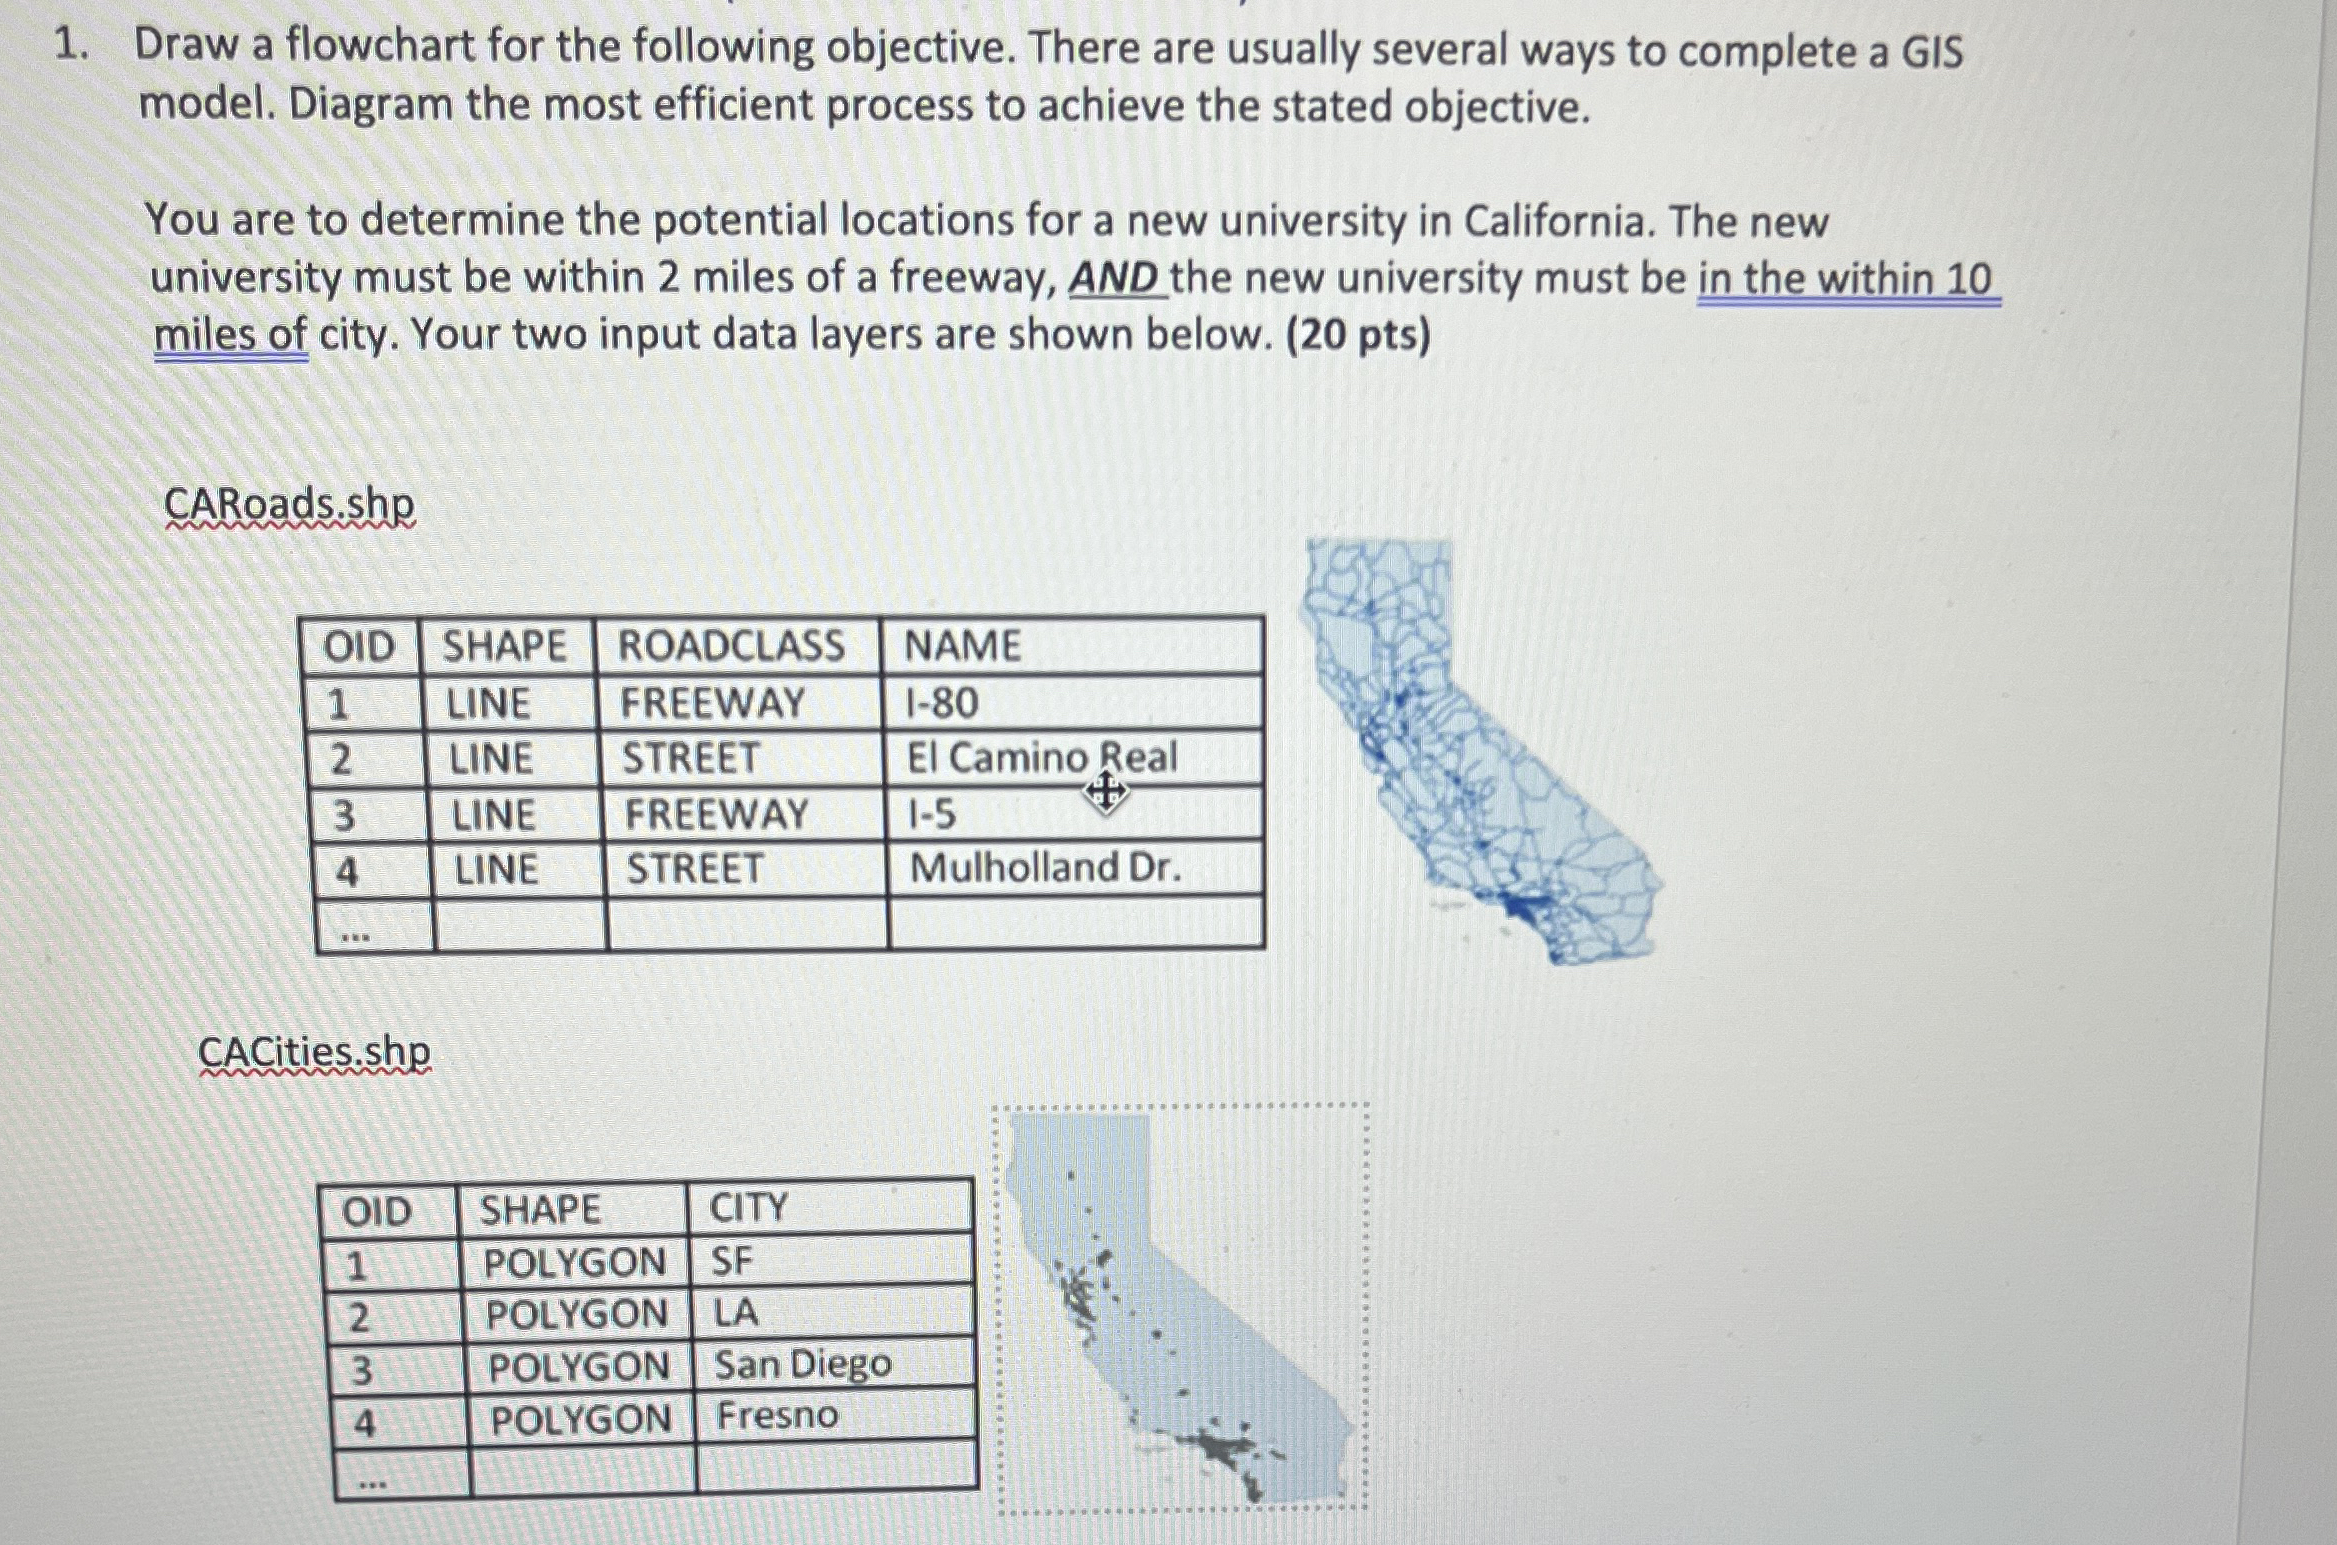
You are to determine the potential locations for a new university in California. The new university must be within miles of a freeway, AND the new university must be in the within miles of city. Your two input data layers are shown below. pts
CARoads.shp
tableOIDSHAPE,ROADCLASS,NAMELINE,FREEWAY,ILINE,STREET,EI Camino RealLINE,FREEWAY,ILINE,STREET,Mulholland Dr
CACities.shp
tableOIDSHAPE,CITYPOLYGON,SFPOLYGON,LAPOLYGON,San DiegoPOLYGON,Fresno
Step by Step Solution
There are 3 Steps involved in it
1 Expert Approved Answer
Step: 1 Unlock

Question Has Been Solved by an Expert!
Get step-by-step solutions from verified subject matter experts
Step: 2 Unlock
Step: 3 Unlock