

Question: Draw a frequency table for the data and find the mode. 2. Calculate Mean from the following data85,96,76,108,85,80,100,85,70,95 Mean: Median: Mode: 3. The following data
Draw a frequency table for the data and find the mode.
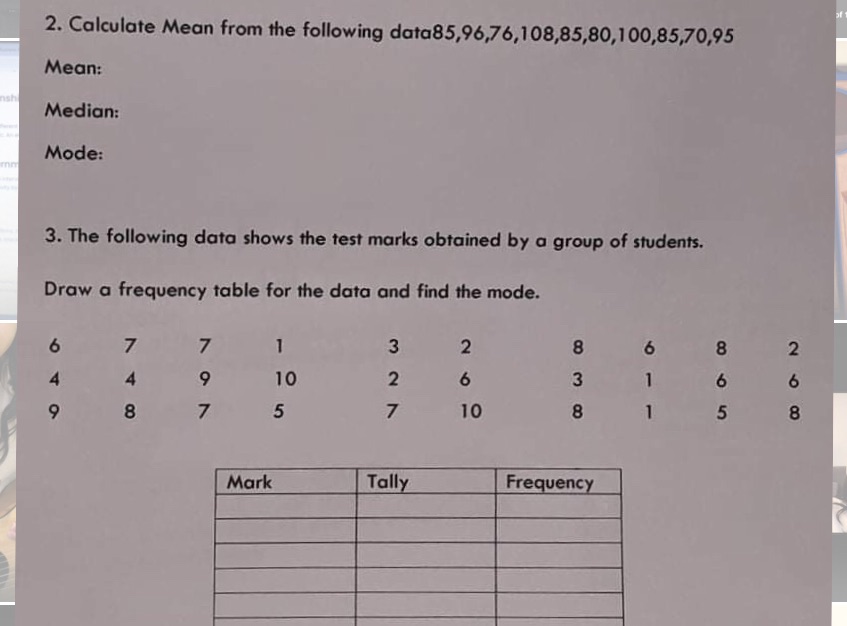
2. Calculate Mean from the following data85,96,76,108,85,80,100,85,70,95 Mean: Median: Mode: 3. The following data shows the test marks obtained by a group of students. Draw a frequency table for the data and find the mode. 3 2 8 8 6 7 - - 0 9 10 6 A A 7 8 8 7 5 10 Mark Tally Frequency
Step by Step Solution
There are 3 Steps involved in it
1 Expert Approved Answer
Step: 1 Unlock

Question Has Been Solved by an Expert!
Get step-by-step solutions from verified subject matter experts
Step: 2 Unlock
Step: 3 Unlock