

Question: Draw a graph of a function g ( x ) . You do not need to provide a formula for your function, just a graph.
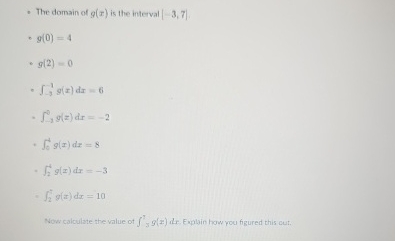
Draw a graph of a function gx You do not need to provide a formula for your function, just a graph. The fun does not need to be continuous. The graph should be clearly labeled so it can be identiidentify the various areas between the curve and the horizontal axis. Use familiar shapes or label the areas. The domain of is the interval
Now calculate the value of Explain how you figured this cut.
Step by Step Solution
There are 3 Steps involved in it
1 Expert Approved Answer
Step: 1 Unlock

Question Has Been Solved by an Expert!
Get step-by-step solutions from verified subject matter experts
Step: 2 Unlock
Step: 3 Unlock