

Question: Draw a graph please and explain your answer The graph shows Mexico's demand for and supply of mangoes. Price (dollars per kilogram) 0' 4.50 77
Draw a graph please and explain your answer
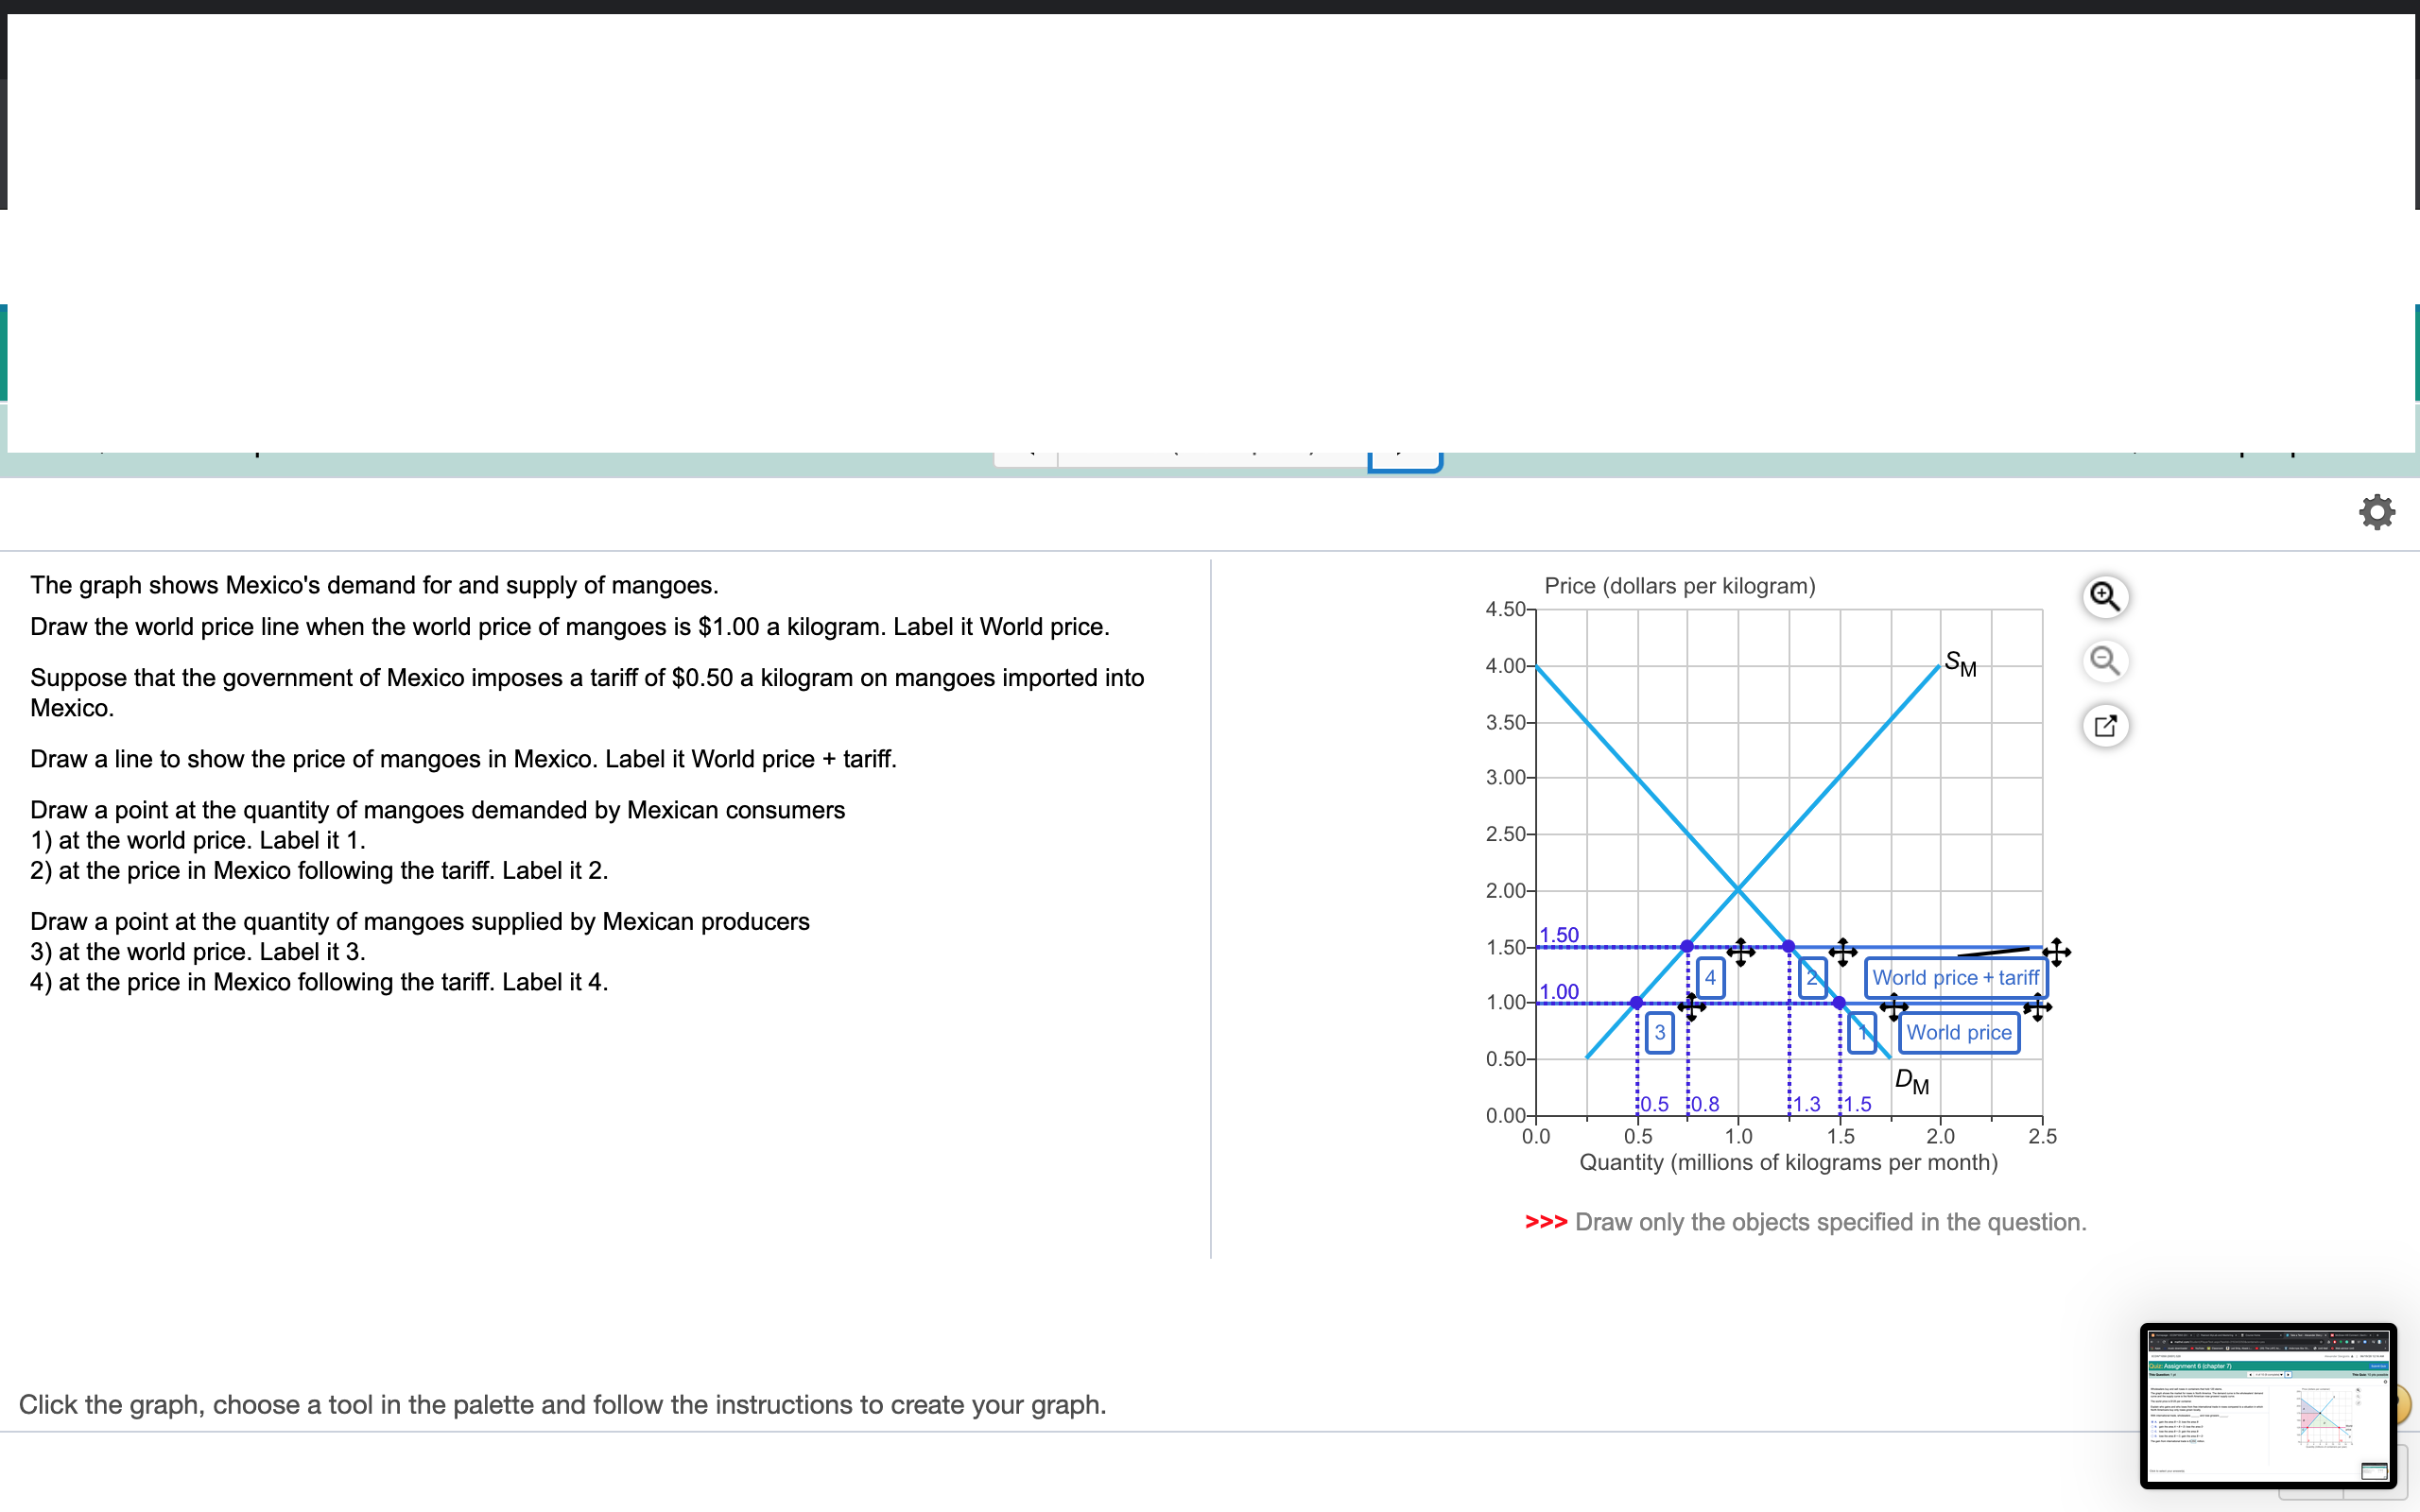
The graph shows Mexico's demand for and supply of mangoes. Price (dollars per kilogram) 0' 4.50 77 Draw the world price line when the world price of mangoes is $1.00 a kilogram. Label it World price. Suppose that the government of Mexico imposes a tariff of $0.50 a kilogram on mangoes imported into 4'00 Mexico. 3.50 Draw a line to show the price of mangoes in Mexico. Label it World price + tariff. 3 00 Draw a point at the quantity of mangoes demanded by Mexican consumers 1) at the world price. Label it 1. 2-50 2) at the price in Mexico following the tariff. Label it 2. Draw a point at the quantity of mangoes supplied by Mexican producers 3) at the world price. Label it 3. 1-50 4) at the price in Mexico following the tariff. Label it 4. 0.0 0.5 1.0 1.5 2.0 25 Quantity (millions of kilograms per month) >>> Draw only the objects specied in the question. Click the graph, choose a tool in the palette and follow the instructions to create your graph
Step by Step Solution
There are 3 Steps involved in it

Get step-by-step solutions from verified subject matter experts