

Question: Draw a graph that illustrates a demand - pull inflation. The graph shows the aggregate demand curve, aggregate supply curve, and the potential GDP line.
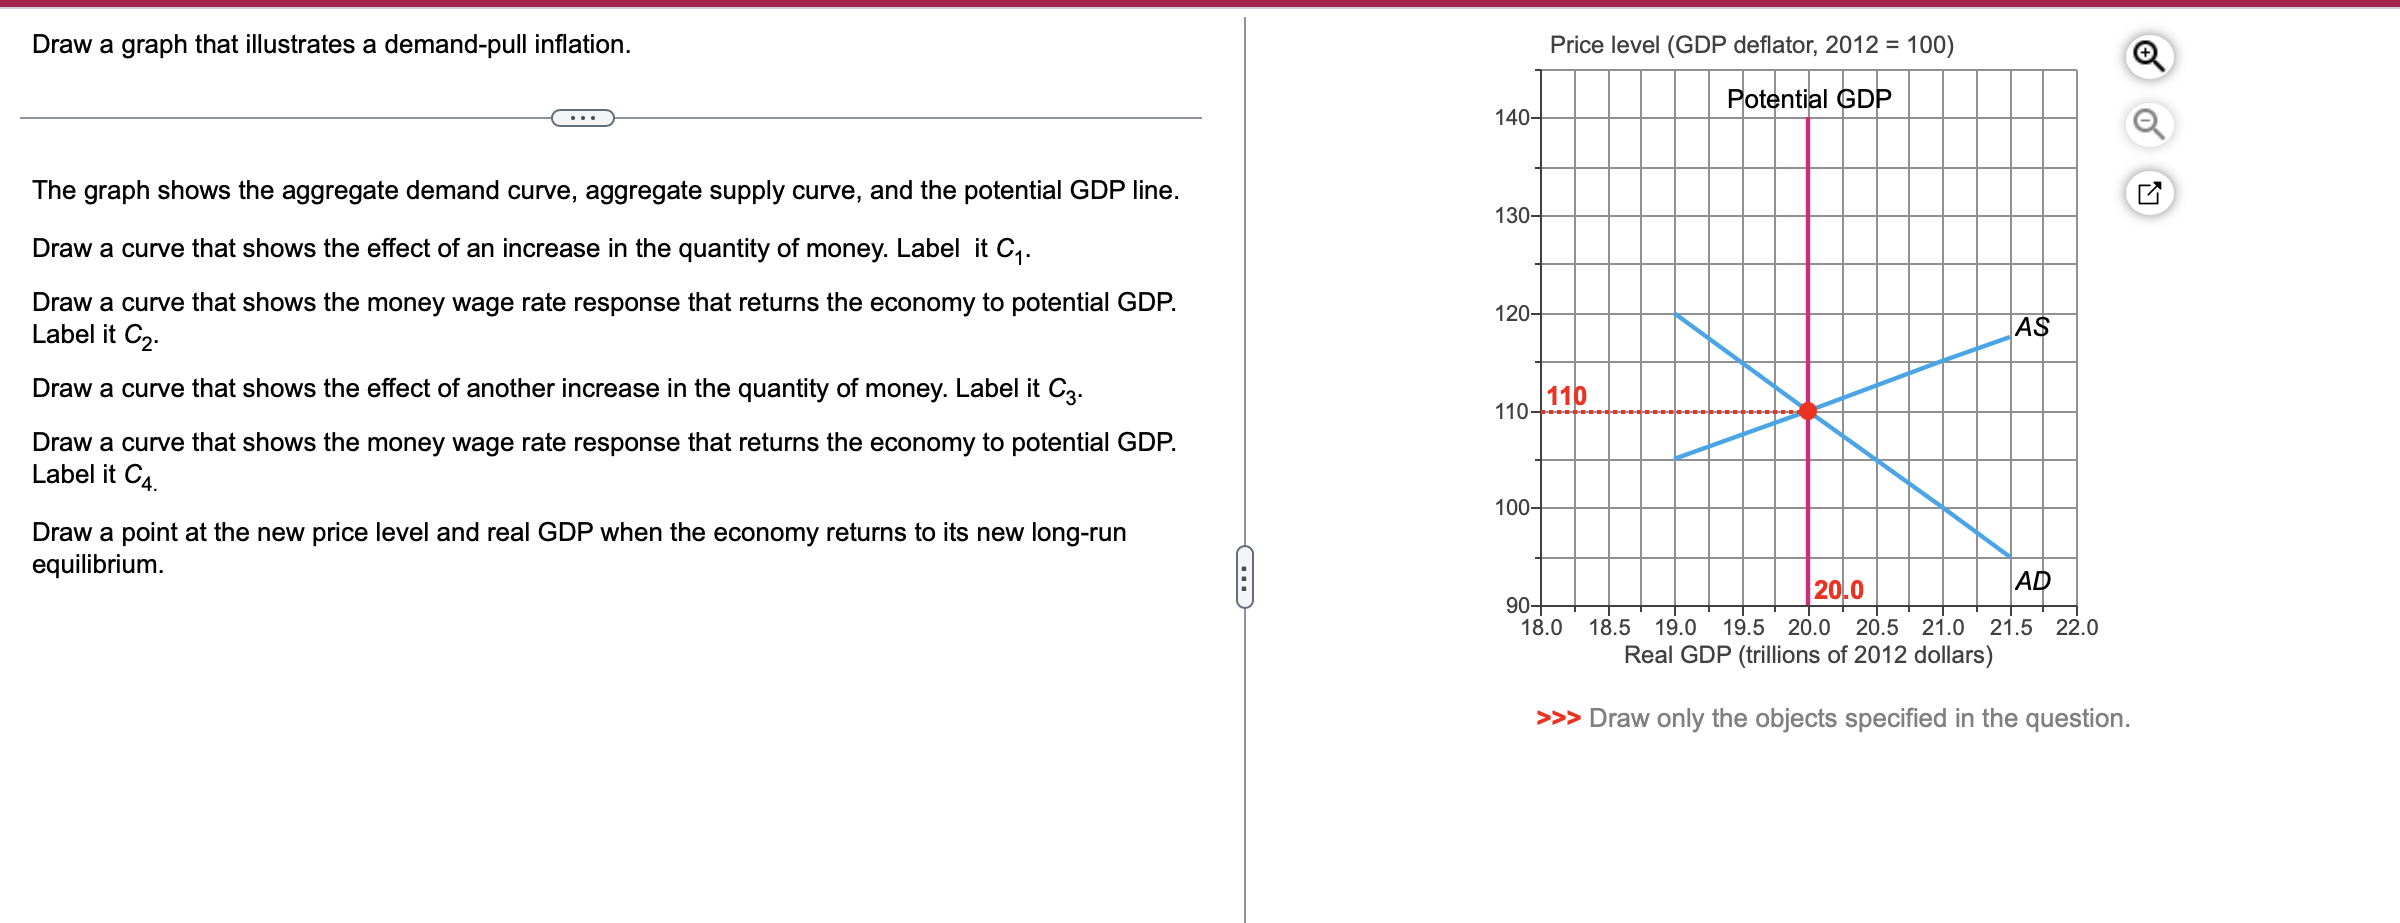
Draw a graph that illustrates a demandpull inflation.
The graph shows the aggregate demand curve, aggregate supply curve, and the potential GDP line.
Draw a curve that shows the effect of an increase in the quantity of money. Label it C
Draw a curve that shows the money wage rate response that returns the economy to potential GDP Label it C
Draw a curve that shows the effect of another increase in the quantity of money. Label it C
Draw a curve that shows the money wage rate response that returns the economy to potential GDP Label it C
Draw a point at the new price level and real GDP when the economy returns to its new longrun equilibrium.
Step by Step Solution
There are 3 Steps involved in it
1 Expert Approved Answer
Step: 1 Unlock

Question Has Been Solved by an Expert!
Get step-by-step solutions from verified subject matter experts
Step: 2 Unlock
Step: 3 Unlock