

Question: Draw a graph that shows marginal cost, average variable cost, and average total cost. Your curves only need to have the proper shape and
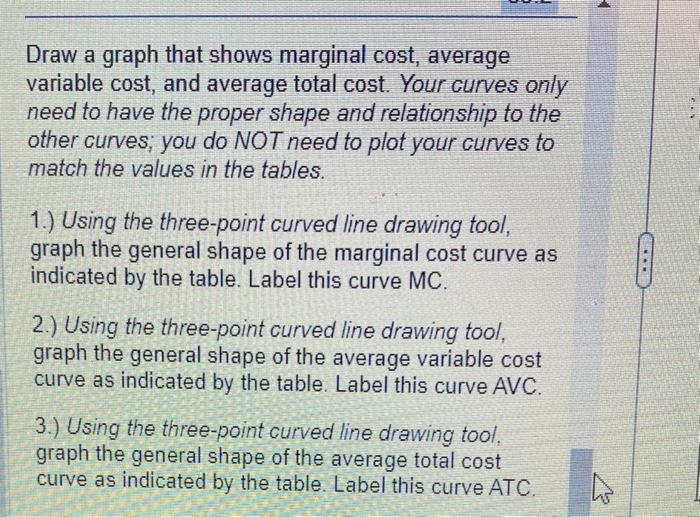
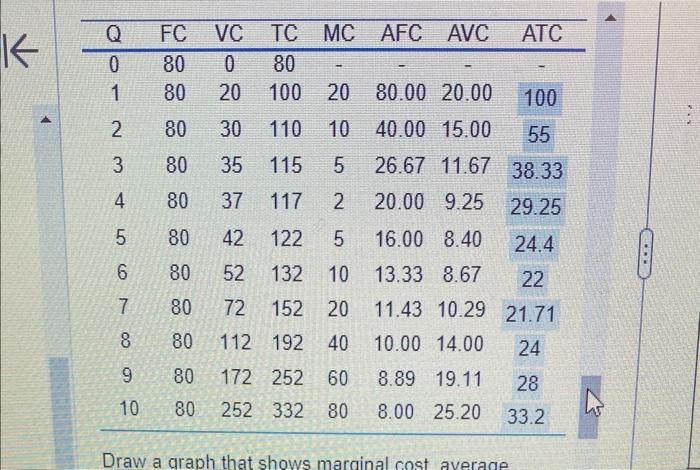
Draw a graph that shows marginal cost, average variable cost, and average total cost. Your curves only need to have the proper shape and relationship to the other curves; you do NOT need to plot your curves to match the values in the tables. 1.) Using the three-point curved line drawing tool, graph the general shape of the marginal cost curve as indicated by the table. Label this curve MC. 2.) Using the three-point curved line drawing tool, graph the general shape of the average variable cost curve as indicated by the table. Label this curve AVC. 3.) Using the three-point curved line drawing tool, graph the general shape of the average total cost curve as indicated by the table. Label this curve ATC. 4 .... K VC TC MC AFC AVC ATC 80 0 80 80 20 100 20 2 80 30 110 10 3 80 35 115 5 4 80 37 117 2 80 42 122 5 80 52 132 10 80 72 152 20 80 112 192 40 80 172 252 60 8.89 19.11 28 80 252 332 80 8.00 25.20 33.2 Q FC 400 LO 5 6 7 8 9 10 - 80.00 20.00 100 40.00 15.00 55 26.67 11.67 38.33 20.00 9.25 29.25 16.00 8.40 24.4 13.33 8.67 22 11.43 10.29 21.71 10.00 14.00 24 Draw a graph that shows marginal cost average: www Draw a graph that shows marginal cost, average variable cost, and average total cost. Your curves only need to have the proper shape and relationship to the other curves; you do NOT need to plot your curves to match the values in the tables. 1.) Using the three-point curved line drawing tool, graph the general shape of the marginal cost curve as indicated by the table. Label this curve MC. 2.) Using the three-point curved line drawing tool, graph the general shape of the average variable cost curve as indicated by the table. Label this curve AVC. 3.) Using the three-point curved line drawing tool, graph the general shape of the average total cost curve as indicated by the table. Label this curve ATC. 4 ....
Step by Step Solution
3.37 Rating (153 Votes )
There are 3 Steps involved in it
Here are the graphed curves for the marginal cost average variable cost and average total cost based ... View full answer

Get step-by-step solutions from verified subject matter experts