

Question: Draw a label a model for Aggregate Demand and Short-Run Aggregate Supply.Draw Long-Run Aggregate Supply (LRAS) on your chart to show the output gap in
Draw a label a model for Aggregate Demand and Short-Run Aggregate Supply.Draw Long-Run Aggregate Supply (LRAS) on your chart to show the output gap in this case.Use the chart to show how the change in business investment spending will affect the economy and the impact on inflation and the RGDP.The chart is attached for reference.
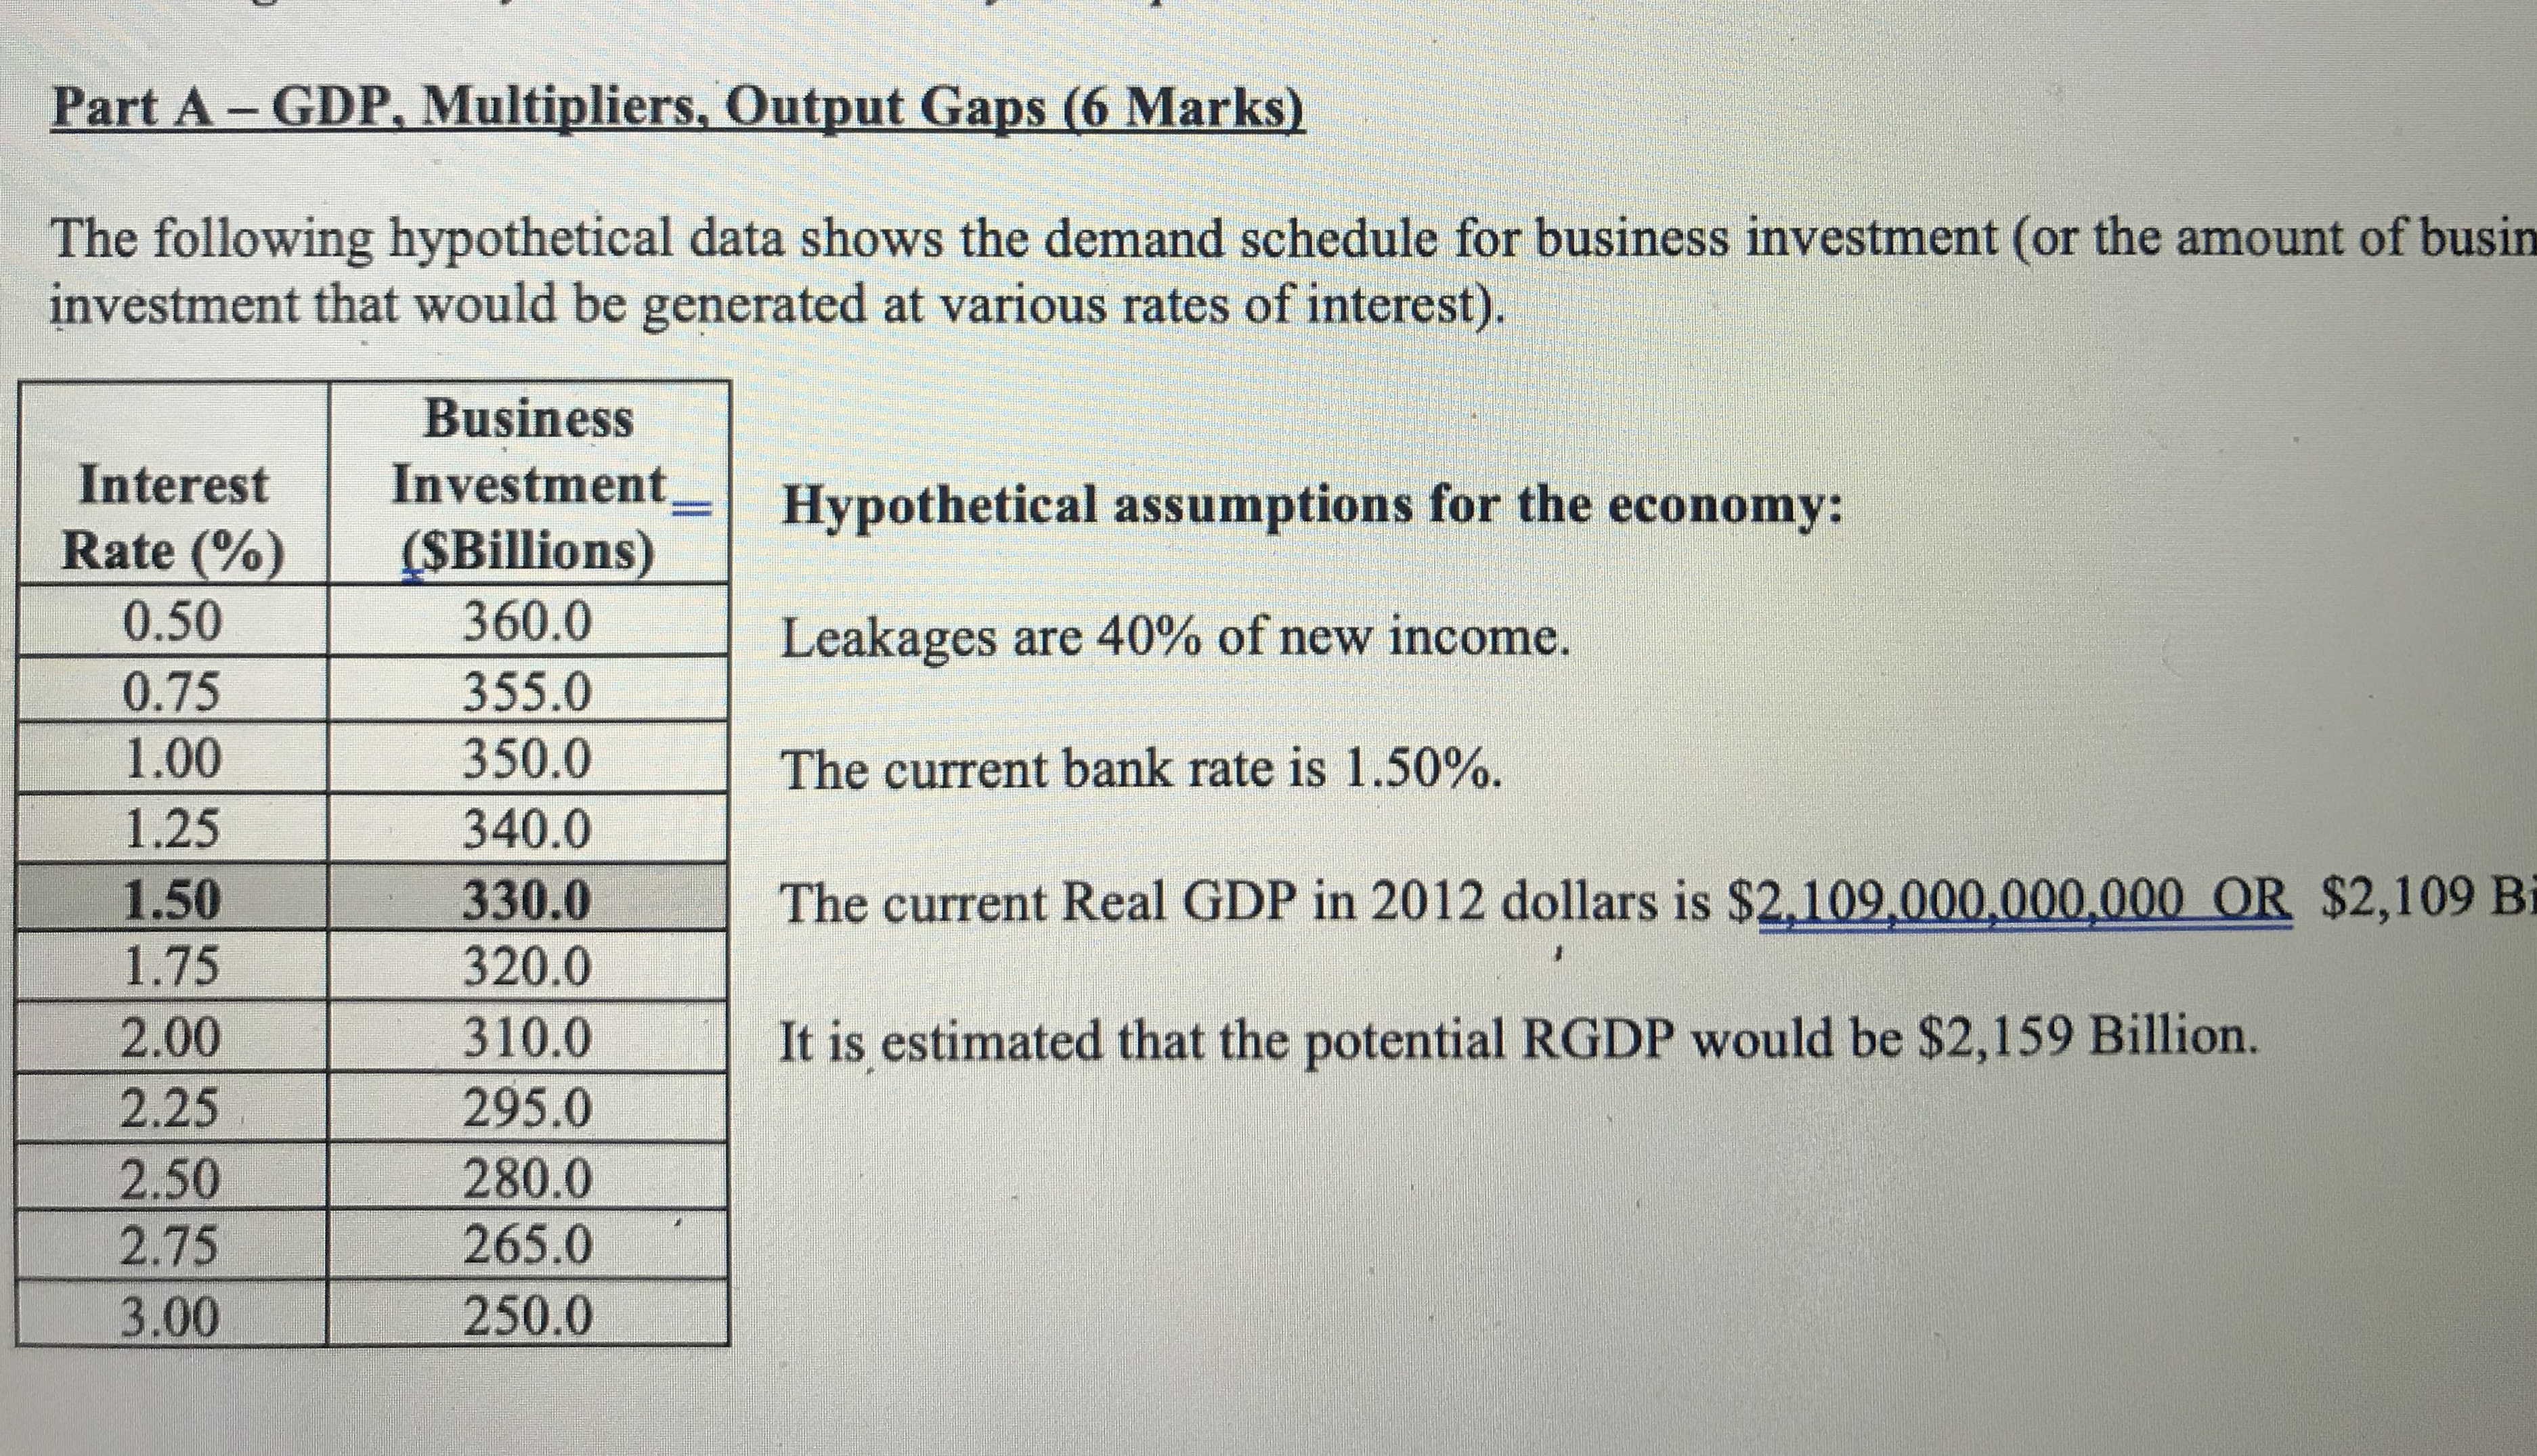
Part A - GDP, Multipliers, Output Gaps (6 Marks) The following hypothetical data shows the demand schedule for business investment ( or the amount of busin investment that would be generated at various rates of interest). Business Interest Investment Rate (%) ($Billions) Hypothetical assumptions for the economy: 0.50 360.0 0.75 355.0 Leakages are 40% of new income. 1.00 350.0 The current bank rate is 1.50%. 1.25 340.0 1.50 330.0 The current Real GDP in 2012 dollars is $2,109,000,000,000 OR $2,109 Bi 1.75 320.0 2.00 310.0 It is estimated that the potential RGDP would be $2,159 Billion. 2.25 295.0 2.50 280.0 2.75 265.0 3.00 250.0
Step by Step Solution
There are 3 Steps involved in it

Get step-by-step solutions from verified subject matter experts