

Question: Draw a one-way sensitivity analysis graph for operation costs for Eagle Airlines. note that the equation for total revenue is: Total Revenue = Revenue from
Draw a one-way sensitivity analysis graph for operation costs for Eagle Airlines.
note that the equation for total revenue is:
Total Revenue = Revenue from Charters + Revenue from Scheduled flights
= (Charter Proportion * Hours Flown * Charter Price) + [(1-Charter Proportion) * Hours Flown * Ticket Price * Number of Passenger Seats*Capacity of Sched Flights]
The values for the various variables are provided in the picture (Note: Please show Operating Cost on the horizontal axis.)
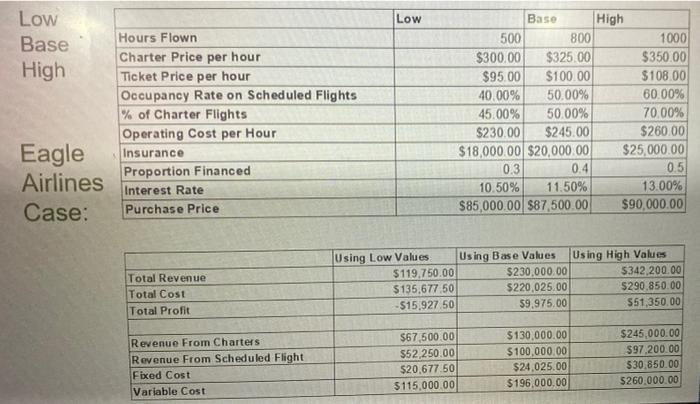
Low Base High Eagle Airlines Case: Hours Flown Charter Price per hour Ticket Price per hour Occupancy Rate on Scheduled Flights % of Charter Flights Operating Cost per Hour Insurance Proportion Financed Interest Rate Purchase Price Total Revenue Total Cost Total Profit Revenue From Charters Revenue From Scheduled Flight Fixed Cost Variable Cost Low Using Low Values $119,750.00 $135,677.50 -$15,927.50. $67,500.00 $52,250.00 $20,677.50 $115,000.00 Base 500 800 $300.00 $325.00 $95.00 $100.00 40.00% 50.00% 45.00% 50.00% $230.00 $245.00 $18,000.00 $20,000.00 0.3 0.4 10.50% 11.50% $85,000.00 $87,500.00 High $130,000.00 $100,000.00 $24,025.00 $196,000.00 1000 $350.00 $108.00 60.00% 70.00% $260.00 $25,000.00 0.5 13.00% $90,000.00 Using Base Values Using High Values $230,000.00 $342,200.00 $220,025.00 $290,850.00 $9,975.00 $51,350.00 $245,000.00 $97,200.00 $30,850.00 $260,000.00
Step by Step Solution
3.37 Rating (150 Votes )
There are 3 Steps involved in it
Answers Profit Total Revenue Total Cost All the inputs that are positively correlated with Total Rev... View full answer

Get step-by-step solutions from verified subject matter experts