

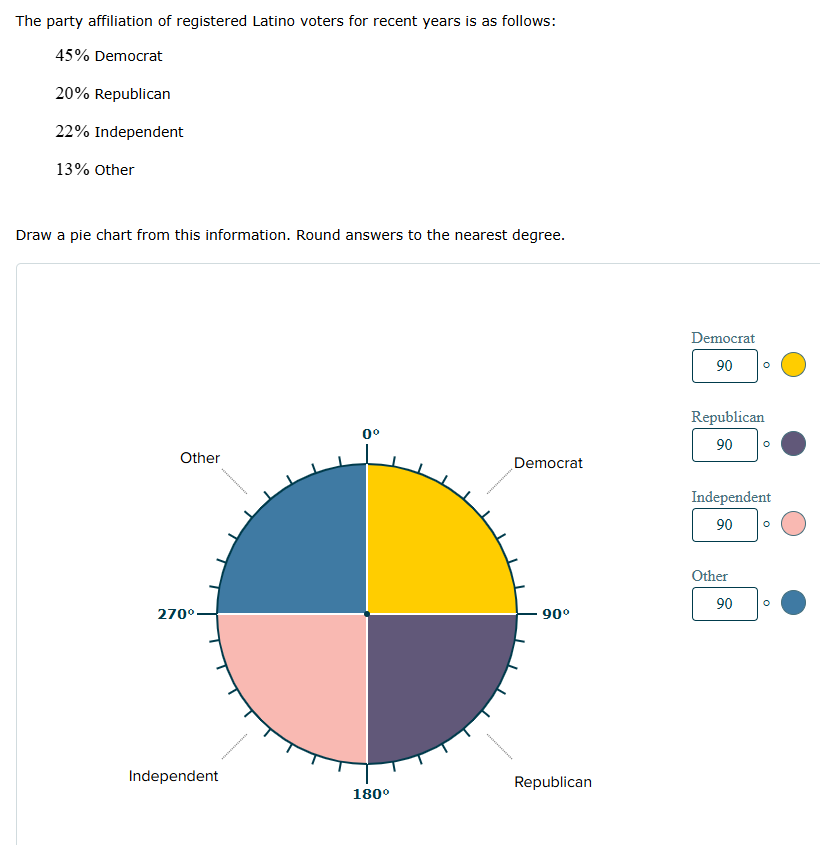
Question: Draw a pie chart from this information. Round answers to the nearest degree. The party affiliation of registered Latino voters for recent years is as
Draw a pie chart from this information. Round answers to the nearest degree.
Step by Step Solution
There are 3 Steps involved in it
1 Expert Approved Answer
Step: 1 Unlock

Question Has Been Solved by an Expert!
Get step-by-step solutions from verified subject matter experts
Step: 2 Unlock
Step: 3 Unlock