

Question: Draw a response diagram for the controller program shown in Figure 2.1 with K = 2 instead of 4. Figure 2.1 01 (COUNT) 02) CNT
Draw a response diagram for the controller program shown in Figure 2.1 with K = 2 instead of 4.
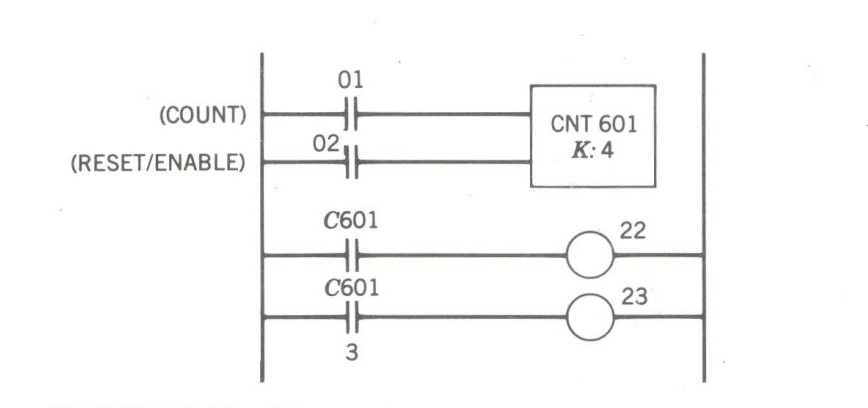 Figure 2.1
Step by Step Solution
There are 3 Steps involved in it
1 Expert Approved Answer
Step: 1 Unlock

Question Has Been Solved by an Expert!
Get step-by-step solutions from verified subject matter experts
Step: 2 Unlock
Step: 3 Unlock