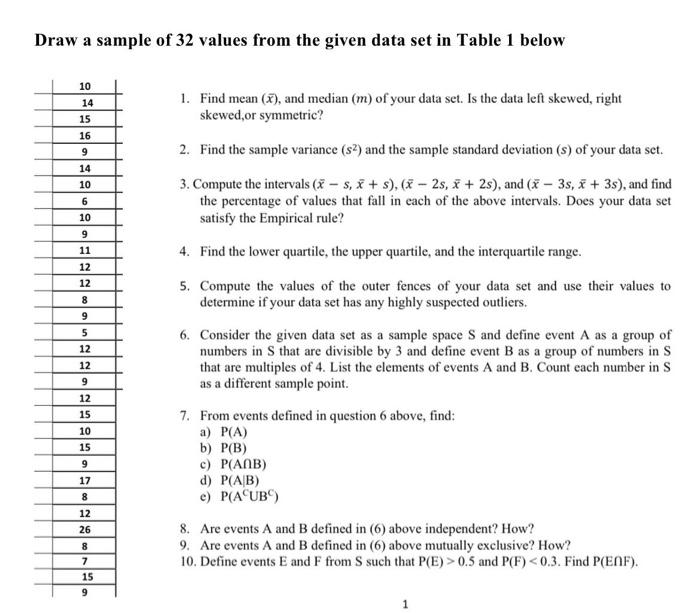
Question: Draw a sample of 32 values from the given data set in Table 1 below 10 14 15 16 9 14 10 6 10 9

Draw a sample of 32 values from the given data
Draw a sample of 32 values from the given data set in Table 1 below 10 14 15 16 9 14 10 6 10 9 11 12 12 1. Find mean (7), and median (m) of your data set. Is the data left skewed, right skewed, or symmetric? 2. Find the sample variance (52) and the sample standard deviation (s) of your data set. 3. Compute the intervals (x - 5,8 + s), (8 - 2s, * + 2s), and (x - 3s, * + 3s), and find the percentage of values that fall in each of the above intervals. Does your data set satisfy the Empirical rule? 4. Find the lower quartile, the upper quartile, and the interquartile range. 5. Compute the values of the outer fences of your data set and use their values to determine if your data set has any highly suspected outliers. 6. Consider the given data set as a sample space and define event A as a group of numbers in that are divisible by 3 and define event B as a group of numbers in S that are multiples of 4. List the elements of events A and B. Count each number in S as a different sample point. 8 9 5 12 12 9 12 15 10 15 9 17 8 7. From events defined in question 6 above, find: a) P(A) b) P(B) c) P(ANB) d) P(AB) e) P(ACUB) 8. Are events A and B defined in (6) above independent? How? 9. Are events A and B defined in (6) above mutually exclusive? How? 10. Define events E and F from such that P(E) > 0.5 and P(F)

Step by Step Solution

There are 3 Steps involved in it

1 Expert Approved Answer
Step: 1 Unlock blur-text-image
Question Has Been Solved by an Expert!

Get step-by-step solutions from verified subject matter experts

Step: 2 Unlock
Step: 3 Unlock

Students Have Also Explored These Related General Management Questions!