

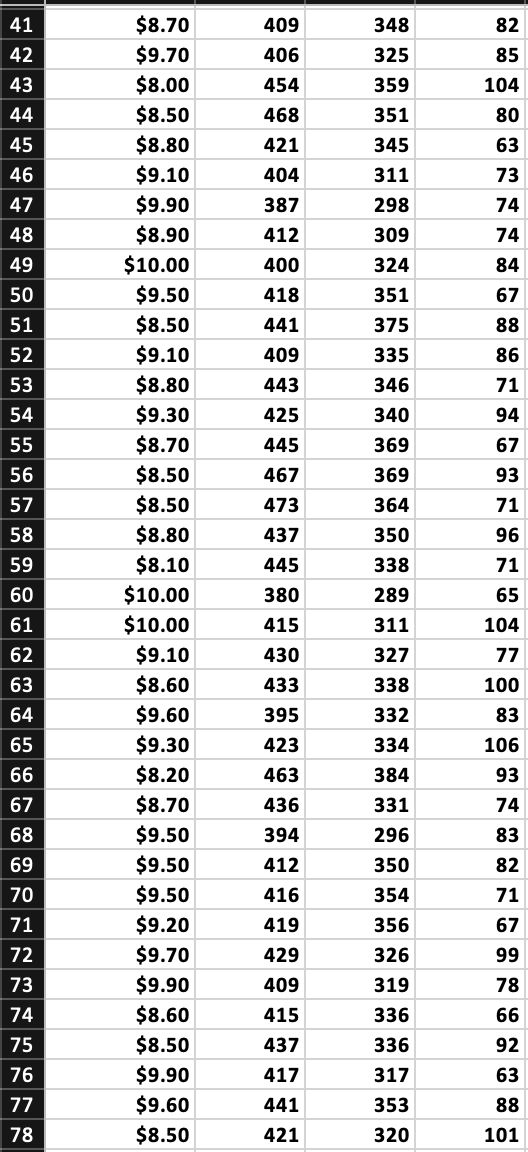
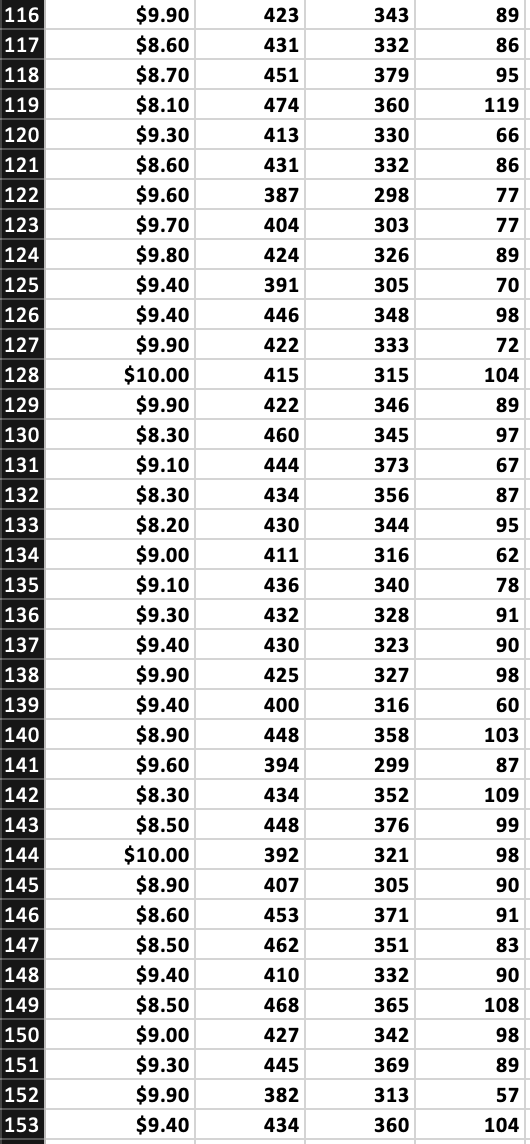
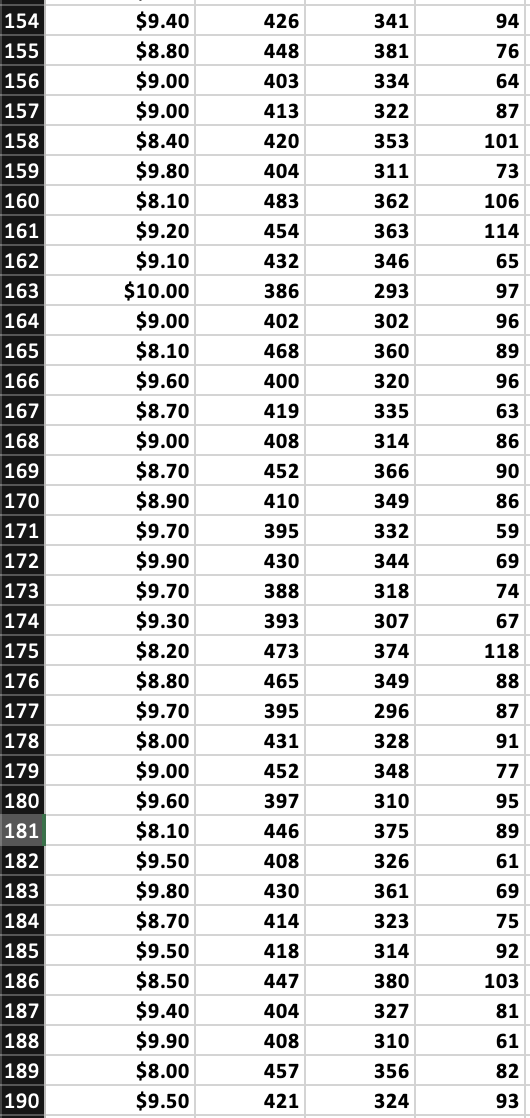
Question: Draw a scatter plot with Bowl Price on the X-axis and demand for bowls, soda, and beer on the Y-axis. Add a trendline to each
Draw a scatter plot with Bowl Price on the X-axis and demand for bowls, soda, and beer on the Y-axis. Add a trendline to each plot. Based on the trendline, demand for which product is (a) most impacted by the Bowl price, (b) least impacted by the Bowl price? Show the scatter plot and write the answer above it.
Run regressions with demand for each product as the dependent variable and Bowl price as the independent. Does Bowl Price significantly affect demand for each product and if so, for which product does it have the biggest impact? Show the regression output and write your answer above it.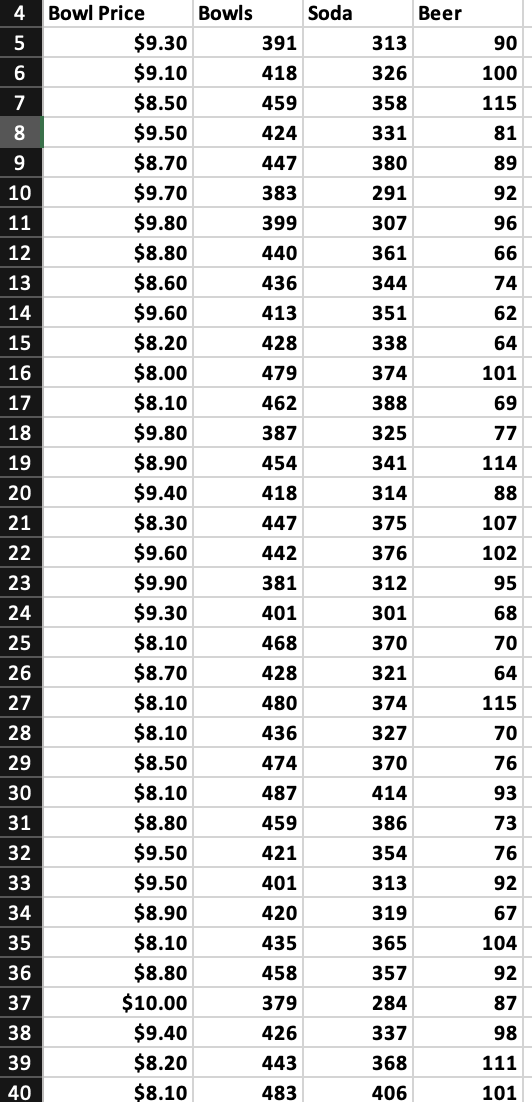
Step by Step Solution
There are 3 Steps involved in it
1 Expert Approved Answer
Step: 1 Unlock

Question Has Been Solved by an Expert!
Get step-by-step solutions from verified subject matter experts
Step: 2 Unlock
Step: 3 Unlock