

Question: Draw an Ogive curve corresponding to the data and use it to eatimate the median Answer ALL the questions in this section. Question 1 (2
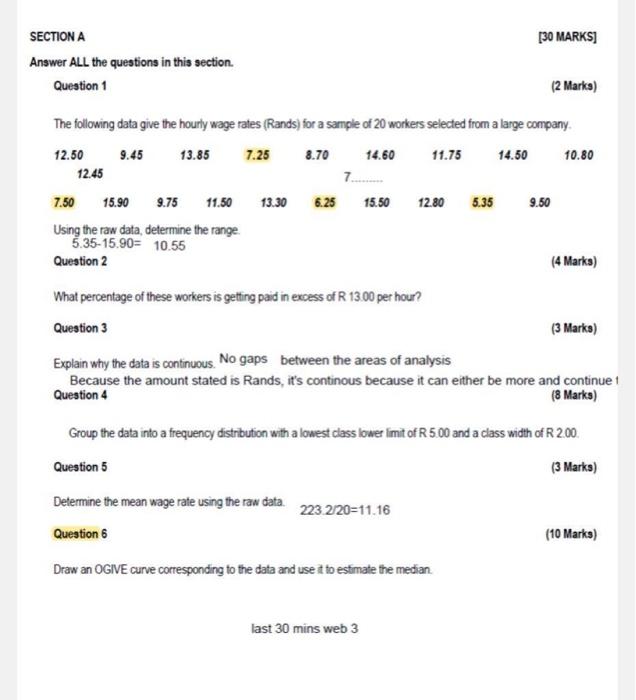
Answer ALL the questions in this section. Question 1 (2 Marks) The following data give the hourly wage rates (Rands) for a sample of 20 workers selected from a large company. Using the raw data, determine the range. 5.3515.90=10.55 Question 2 (4 Marks) What percentage of these workers is getting paid in excess of R13.00 per hour? Question 3 (3 Marks) Explain why the data is continuous. No gaps between the areas of analysis Because the amount stated is Rands, it's continous because it can either be more and continue 1 Question 4 (8 Marks) Group the data into a frequency distribution with a lowest class lower Imit of R5.00 and a class width of R2.00
Step by Step Solution
There are 3 Steps involved in it

Get step-by-step solutions from verified subject matter experts