

Question: Draw and solve the Cash Flow Diagram for Future Value F12. The data below is a 10 year Cash Flow, and interest rate is a
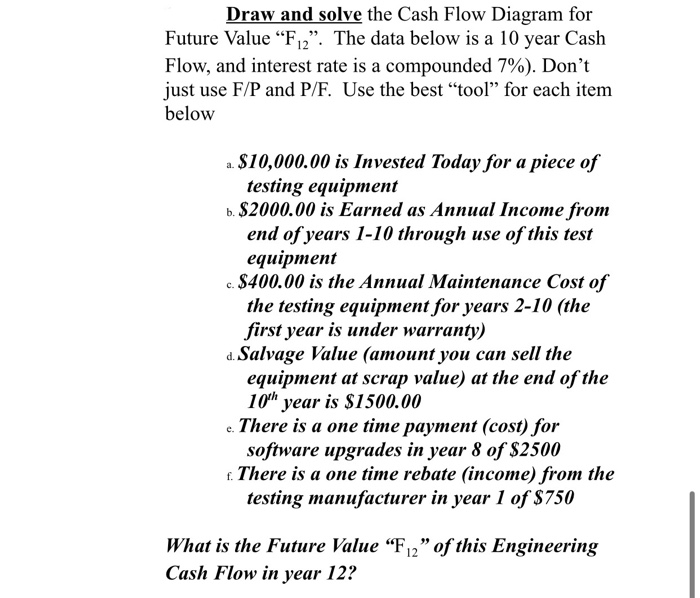
Draw and solve the Cash Flow Diagram for Future Value "F2". The data below is a 10 year Cash Flow, and interest rate is a compounded 7%). Don't just use F/P and P/F. Use the best "tool for each item below ..$10,000.00 is Invested Today for a piece of testing equipment b. $2000.00 is Earned as Annual Income from end of years 1-10 through use of this test equipment c. $400.00 is the Annual Maintenance Cost of the testing equipment for years 2-10 (the first year is under warranty) d. Salvage Value (amount you can sell the equipment at scrap value) at the end of the 10 year is $1500.00 e. There is a one time payment (cost) for software upgrades in year 8 of $2500 r. There is a one time rebate (income) from the testing manufacturer in year 1 of $750 What is the Future Value "F2" of this Engineering Cash Flow in year 12
Step by Step Solution
There are 3 Steps involved in it

Get step-by-step solutions from verified subject matter experts