

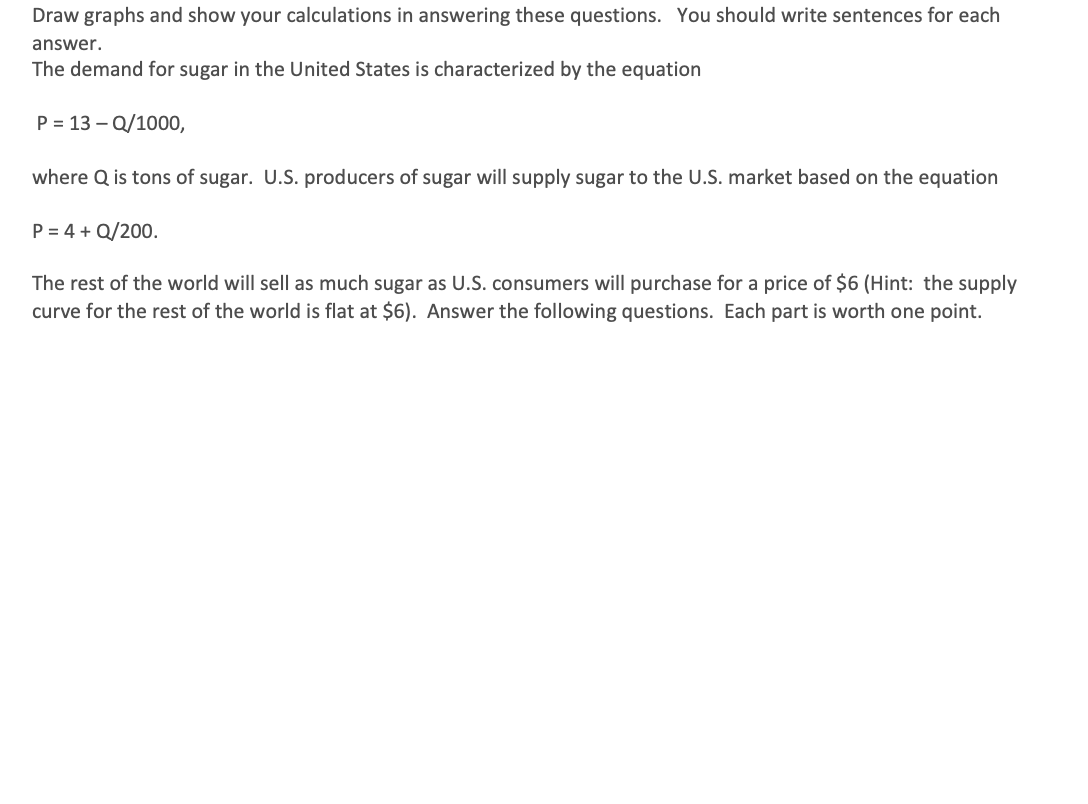
Draw graphs and show your calculations in answering these questions. You should write sentences for each...
Fantastic news! We've Found the answer you've been seeking!
Question:
Expert Answer:
As per the condition we must find the equilibrium quantity and price in US market and at equili... View the full answer

Related Book For 
Posted Date:
