

Question: Draw in Excel c) Sketch the P versus T phase diagram for this gas at low temperatures. Annotate your diagram to denote all of the
Draw in Excel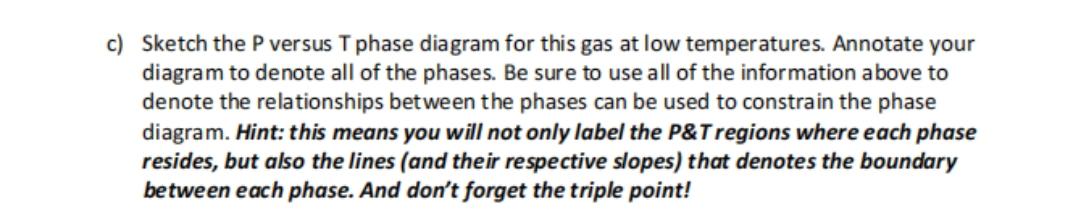
c) Sketch the P versus T phase diagram for this gas at low temperatures. Annotate your diagram to denote all of the phases. Be sure to use all of the information above to denote the relationships between the phases can be used to constrain the phase diagram. Hint: this means you will not only label the P&T regions where each phase resides, but also the lines (and their respective slopes) that denotes the boundary between each phase. And don't forget the triple point!
Step by Step Solution
3.46 Rating (166 Votes )
There are 3 Steps involved in it
Pressure solid phase critical pressure Pcr Ptp triple point Ttp compressible liquid liq... View full answer

Get step-by-step solutions from verified subject matter experts