

Question: Draw out the GANTT chart for the following processes using SJF scheduling. However, in doing so, add 1 unit of delay each time a context
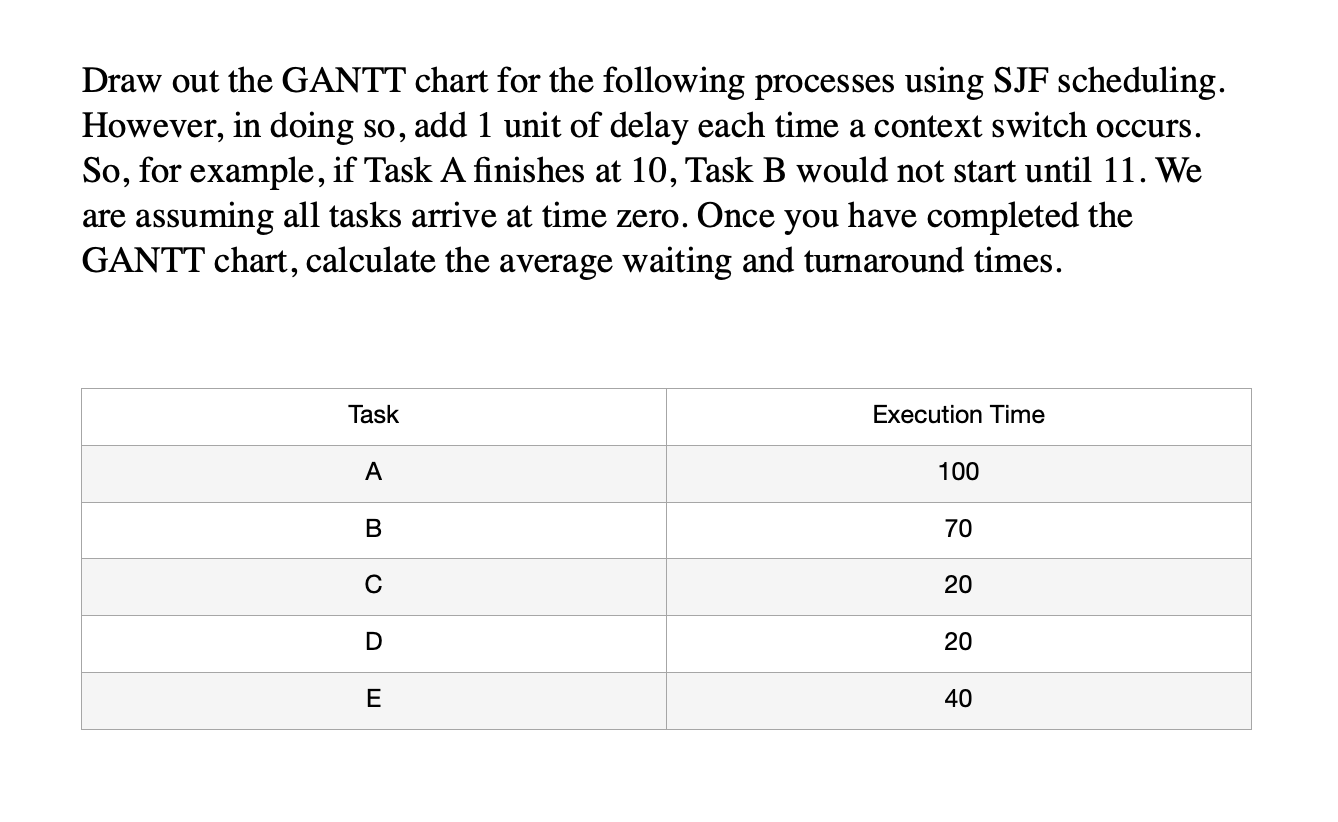
Draw out the GANTT chart for the following processes using SJF scheduling. However, in doing so, add 1 unit of delay each time a context switch occurs. So, for example, if Task A finishes at 10, Task B would not start until 11. We are assuming all tasks arrive at time zero. Once you have completed the GANTT chart, calculate the average waiting and turnaround times. Task Execution Time A 100 B 70 20 D 20 E 40
Step by Step Solution
There are 3 Steps involved in it
1 Expert Approved Answer
Step: 1 Unlock

Question Has Been Solved by an Expert!
Get step-by-step solutions from verified subject matter experts
Step: 2 Unlock
Step: 3 Unlock