

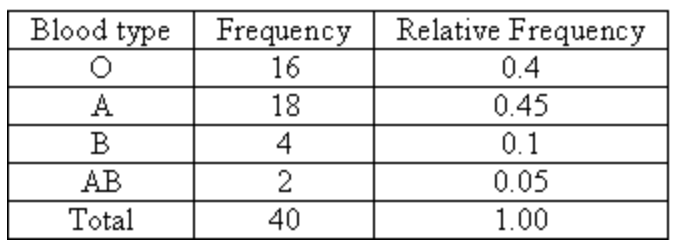
Question: Draw Pie Chart, Bar chart For each table in Excel and Blood typeFrequency Relative Frequency 16 18 4 0.4 0.45 0.1 0.05 1.00 A. AB
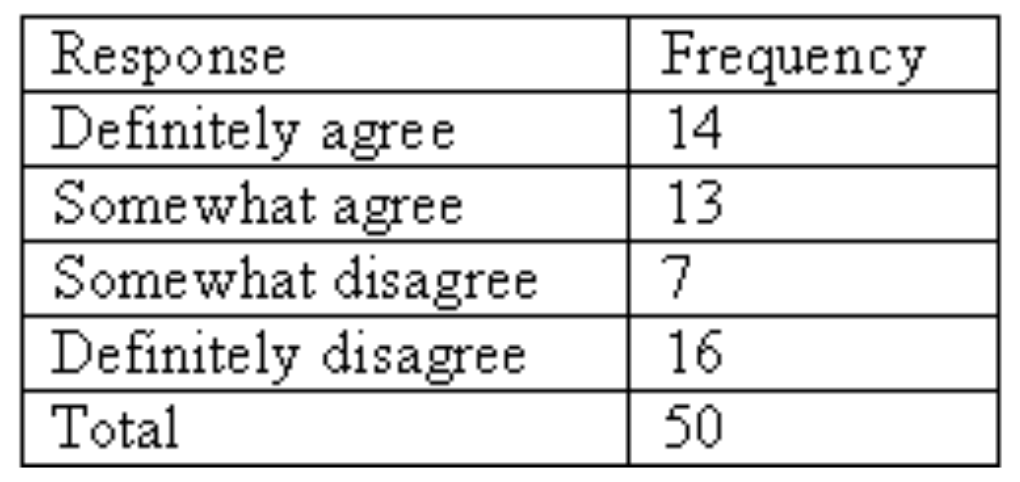
Draw Pie Chart, Bar chart
For each table in Excel
and
Blood typeFrequency Relative Frequency 16 18 4 0.4 0.45 0.1 0.05 1.00 A. AB Total 40
Step by Step Solution
There are 3 Steps involved in it
1 Expert Approved Answer
Step: 1 Unlock

Question Has Been Solved by an Expert!
Get step-by-step solutions from verified subject matter experts
Step: 2 Unlock
Step: 3 Unlock