

Question: Draw the cost curves based on the completed data then describe the behavior of each curve Q TFC TVC TC MC AFC AVC ATC 0
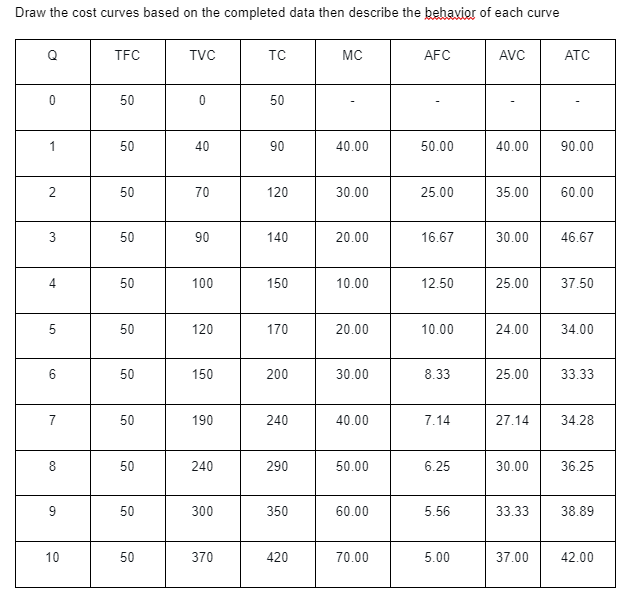
Draw the cost curves based on the completed data then describe the behavior of each curve Q TFC TVC TC MC AFC AVC ATC 0 50 0 50 1 50 40 90 40.00 50.00 40.00 90.00 2 50 70 120 30.00 25.00 35.00 60.00 3 50 90 140 20.00 16.67 30.00 46.67 4 50 100 150 10.00 12.50 25.00 37.50 5 50 120 170 20.00 10.00 24.00 34.00 6 50 150 200 30.00 8.33 25.00 33.33 7 50 190 240 40.00 7.14 27.14 34.28 B 50 240 290 50.00 6.25 30.00 36.25 9 50 300 350 60.00 5.56 33.33 38.89 10 50 370 420 70.00 5.00 37.00 42.00
Step by Step Solution
There are 3 Steps involved in it
1 Expert Approved Answer
Step: 1 Unlock

Question Has Been Solved by an Expert!
Get step-by-step solutions from verified subject matter experts
Step: 2 Unlock
Step: 3 Unlock