

Question: Draw the cumulative frequency graph and determine and explain is it normal distribution or not. cumulative frequency current frequency all previous upper frequencies + Class
Draw the cumulative frequency graph and determine and explain is it normal distribution or not.
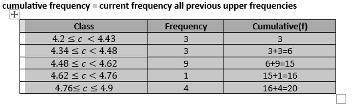
cumulative frequency current frequency all previous upper frequencies + Class 4.2 c < 4.43 4.34 4.48 4.48 c < 4.62 4.62 4.76 4.76 c 4.9 Frequency 3 ww 3 9 1 St 4 Cumulative (1) 3 3+3=6 6+9 13 15+1=16 16+4=20
Step by Step Solution
There are 3 Steps involved in it
1 Expert Approved Answer
Step: 1 Unlock

solutions step1 Answer Plotting the Cumulative Frequency Graph We will use the provided cumulative frequency data to plot a graph The xaxis will represent the upper bounds of the classes while the yax... View full answer
Question Has Been Solved by an Expert!
Get step-by-step solutions from verified subject matter experts
Step: 2 Unlock
Step: 3 Unlock