

Question: Draw the Gantt chart and Find the average waiting time for each of the following scheduling algorithms: 1- FCFS (First come first serve) algorithm. 2-
Draw the Gantt chart and Find the average waiting time for each of the following scheduling algorithms: 1- FCFS (First come first serve) algorithm. 2- SJF (Shortest job first non preemptive) 3- SRT (Shortest remaining time) aka (SJF Preemptive) algorithm. 4- Priority scheduling algorithm (Preemptive). 5- RR (Round Robin) algorithms. Assume the Round Robin algorithm with quantum=8 MSc.
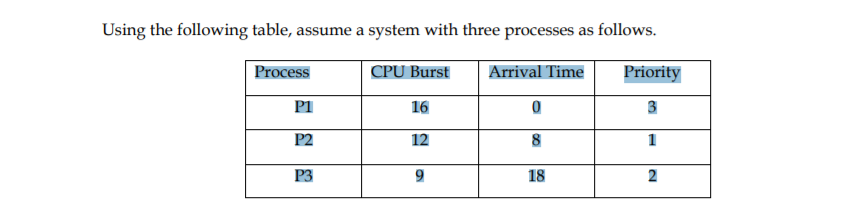
Using the following table, assume a system with three processes as follows. Process CPU Burst Arrival Time Priority P1 16 0 3 P2 12 8 1 P3 9 18 2. 2
Step by Step Solution
There are 3 Steps involved in it
1 Expert Approved Answer
Step: 1 Unlock

Question Has Been Solved by an Expert!
Get step-by-step solutions from verified subject matter experts
Step: 2 Unlock
Step: 3 Unlock