

Question: Draw the graph The data in the following table give information about the total cost of production (in dollars), where quantity is q and total
Draw the graph
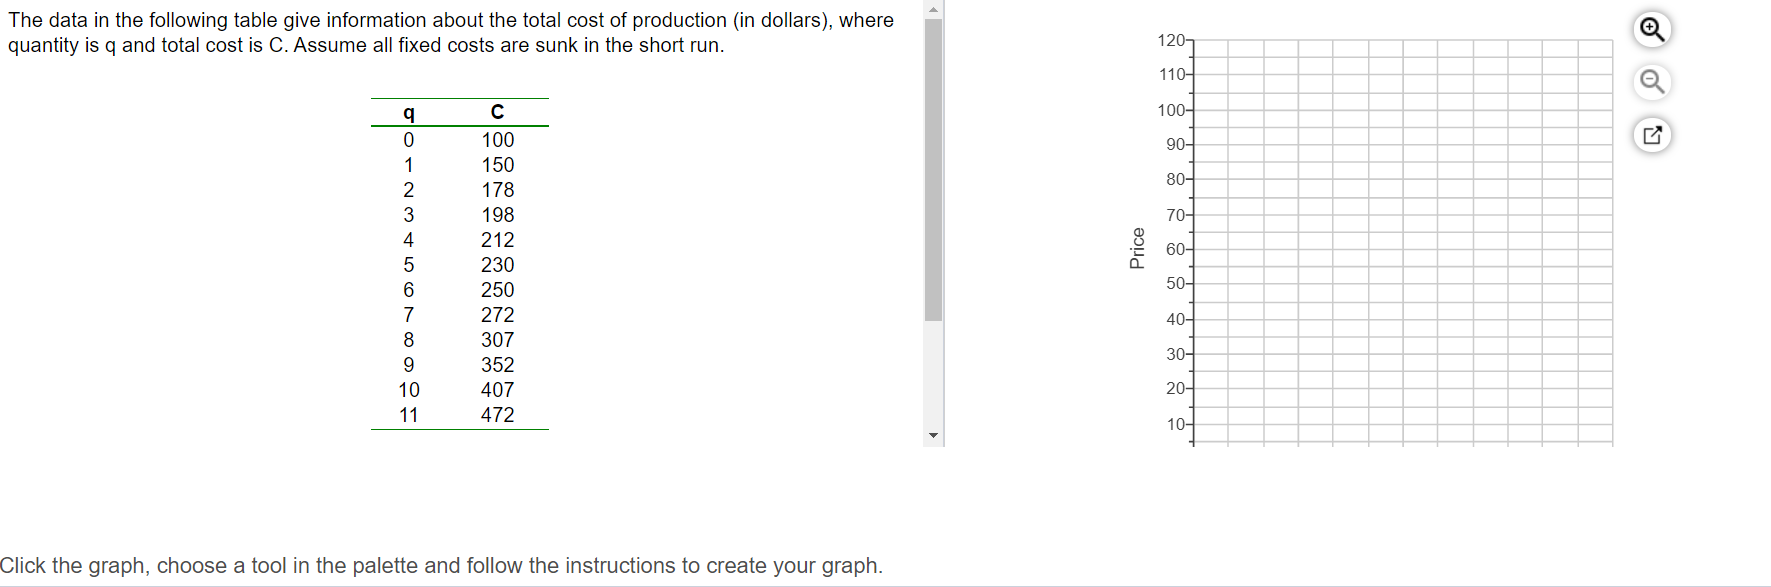
The data in the following table give information about the total cost of production (in dollars), where quantity is q and total cost is C. Assume all fixed costs are sunk in the short run. (2 100 150 173 198 212 230 250 272 307 352 407 472 'Dm'JOU'I-#Ll\\J\\O. _\\_\\. AD Click the graph, choose a tool in the palette and follow the instructions to create your graph. Price 120
Step by Step Solution
There are 3 Steps involved in it
1 Expert Approved Answer
Step: 1 Unlock

Question Has Been Solved by an Expert!
Get step-by-step solutions from verified subject matter experts
Step: 2 Unlock
Step: 3 Unlock