

Question: Draw the graph/Chart from the USGS water distribution data, analyze the freshwater availability globally. *Draw graph in MS Excel. Percent of total water USGS Data
Draw the graph/Chart from the USGS water distribution data, analyze the freshwater availability globally.
*Draw graph in MS Excel.
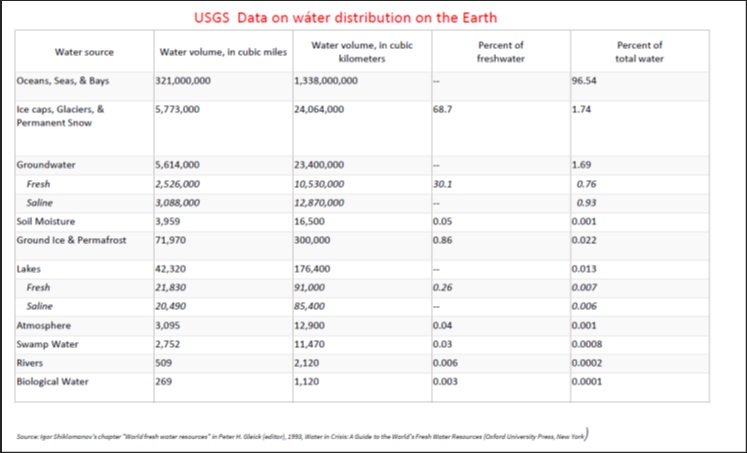
Percent of total water USGS Data on water distribution on the Earth Water volume, in cubic Percent of Water volume, in cubic miles kilometers freshwater 321,000,000 1,338,000,000 5,773,000 24,064,000 Water source Oceans, Seas, & Bays Ice caps, Glaciers, & Permanent Snow 96.54 68.7 1.74 1.69 30.1 Groundwater Fresh Saline Soil Moisture Ground Ice & Permafrost 5,614,000 2,526,000 3,088,000 3,959 71,970 23,400,000 10,530,000 12,870,000 16,500 300,000 0.76 0.93 0.05 0.001 0.86 0.022 Lakes 176,400 0.013 0.007 Fresh 0.26 42,320 21,830 20,490 3,095 91,000 85,400 0.04 Saline Atmosphere Swamp Water Rivers Biological Water 12.900 11,470 2,752 0.03 0.006 0.001 0.0008 0.0002 0.0001 509 2,120 0.006 269 1,120 0.003 wschap Haridus water dar K. Chas acted, 1992, pleader a Cra A ser Bestron (stard University Press, New York)
Step by Step Solution
There are 3 Steps involved in it

Get step-by-step solutions from verified subject matter experts