

Question: Draw the histogram for these data using an initial class boundary of 60.5 and a class width of 5 . Note that you can add
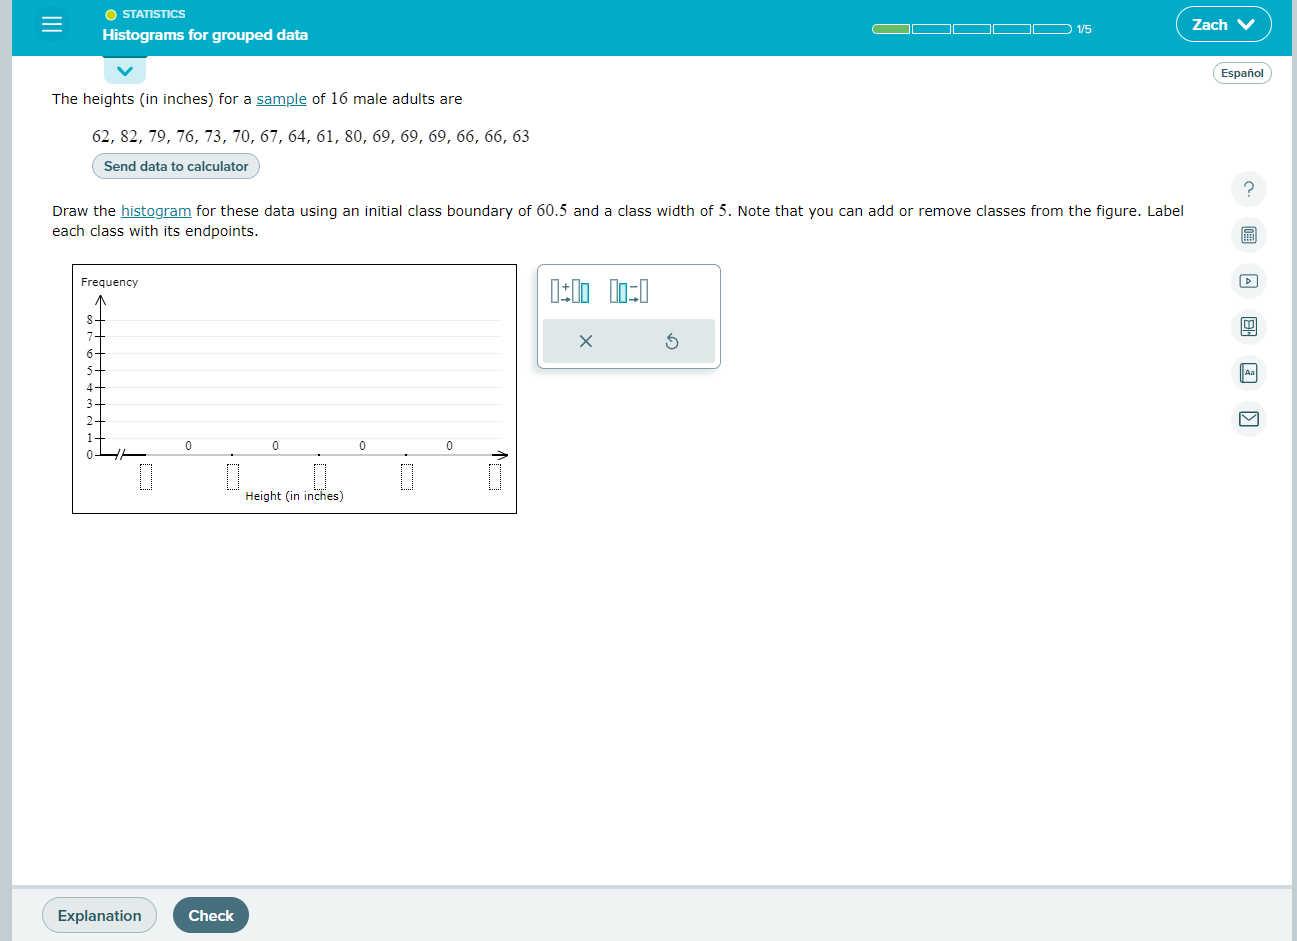
Draw the histogram for these data using an initial class boundary of 60.5 and a class width of 5 . Note that you can add or remove classes from the figure. Label each class with its endpoints
Step by Step Solution
There are 3 Steps involved in it
1 Expert Approved Answer
Step: 1 Unlock

Question Has Been Solved by an Expert!
Get step-by-step solutions from verified subject matter experts
Step: 2 Unlock
Step: 3 Unlock