

Question: 1. 25, 22, 18, 35, 37, 34, 31, 36, 36, 36, 33, 33, 30, 30, 26, 26, 26. Draw the histogram for these data
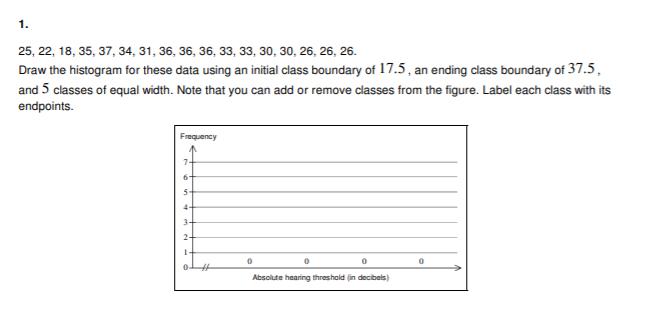
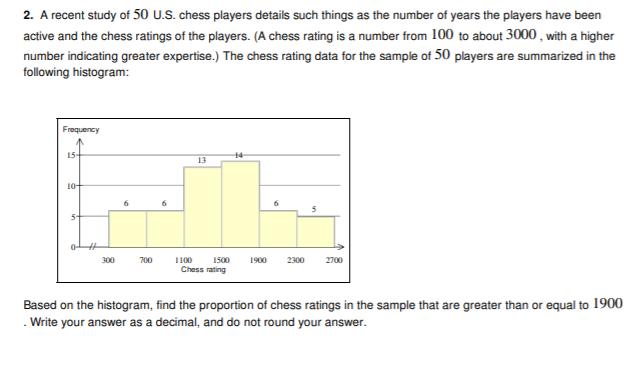
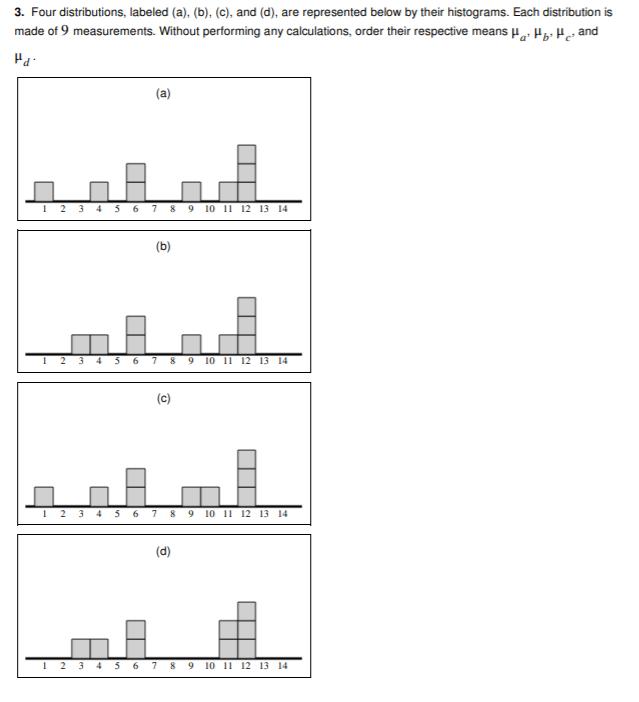
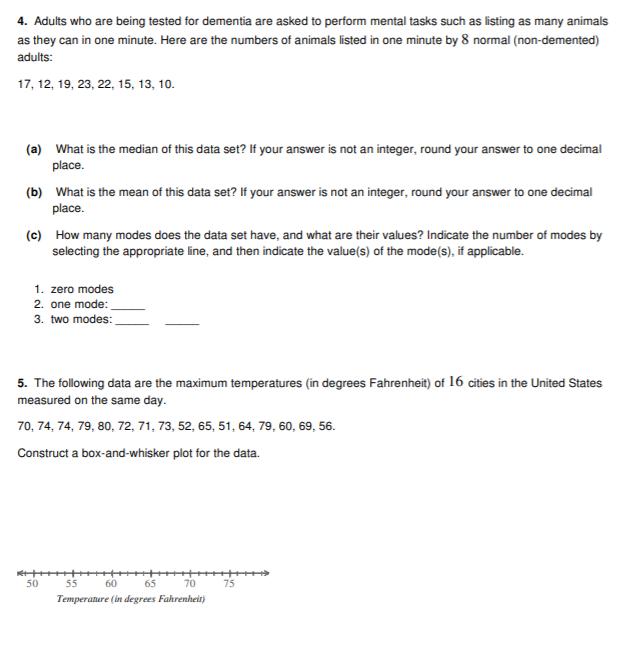
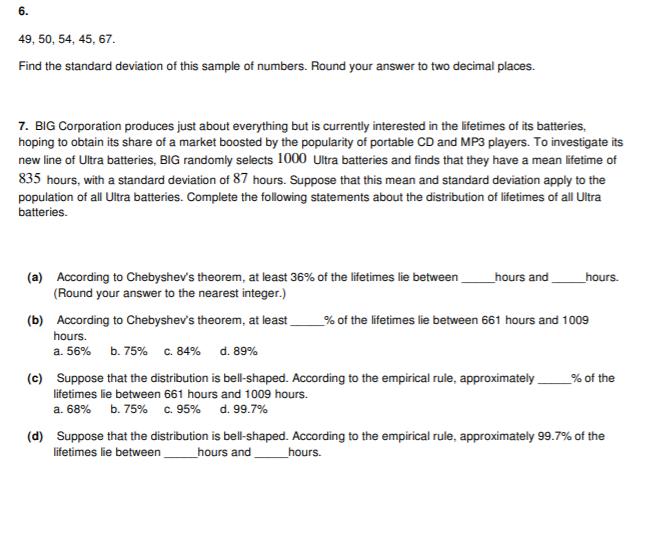
1. 25, 22, 18, 35, 37, 34, 31, 36, 36, 36, 33, 33, 30, 30, 26, 26, 26. Draw the histogram for these data using an initial class boundary of 17.5, an ending class boundary of 37.5, and 5 classes of equal width. Note that you can add or remove classes from the figure. Label each class with its endpoints. Frequency 7 6 5- 4- 3- 2- 1 0- # 0 0 0 Absolute hearing threshold (in decibels) 0 2. A recent study of 50 U.S. chess players details such things as the number of years the players have been active and the chess ratings of the players. (A chess rating is a number from 100 to about 3000, with a higher number indicating greater expertise.) The chess rating data for the sample of 50 players are summarized in the following histogram: Frequency 10+ M 6 6 300 700 15 13 14 1100 1500 1900 Chess rating 6 2300 2700 Based on the histogram, find the proportion of chess ratings in the sample that are greater than or equal to 1900 .Write your answer as a decimal, and do not round your answer. 3. Four distributions, labeled (a), (b), (c), and (d), are represented below by their histograms. Each distribution is made of 9 measurements. Without performing any calculations, order their respective means H H H and Pa 12 34 5 6 (a) 7 8 9 10 11 12 13 14 (b) 1234 5 6 7 8 9 10 11 12 13 14 (c) 1 2 3 4 5 6 7 8 9 10 11 12 13 14 9 10 11 12 13 14 4. Adults who are being tested for dementia are asked to perform mental tasks such as listing as many animals as they can in one minute. Here are the numbers of animals listed in one minute by 8 normal (non-demented) adults: 17, 12, 19, 23, 22, 15, 13, 10. (a) What is the median of this data set? If your answer is not an integer, round your answer to one decimal place. (b) What is the mean of this data set? If your answer is not an integer, round your answer to one decimal place. (c) How many modes does the data set have, and what are their values? Indicate the number of modes by selecting the appropriate line, and then indicate the value(s) of the mode(s), if applicable. 1. zero modes 2. one mode: 3. two modes: 5. The following data are the maximum temperatures (in degrees Fahrenheit) of 16 cities in the United States measured on the same day. 70, 74, 74, 79, 80, 72, 71, 73, 52, 65, 51, 64, 79, 60, 69, 56. Construct a box-and-whisker plot for the data. ++++++ 50 65 70 55 60 Temperature (in degrees Fahrenheit) 75 6. 49, 50, 54, 45, 67. Find the standard deviation of this sample of numbers. Round your answer to two decimal places. 7. BIG Corporation produces just about everything but is currently interested in the lifetimes of its batteries, hoping to obtain its share of a market boosted by the popularity of portable CD and MP3 players. To investigate its new line of Ultra batteries, BIG randomly selects 1000 Ultra batteries and finds that they have a mean lifetime of 835 hours, with a standard deviation of 87 hours. Suppose that this mean and standard deviation apply to the population of all Ultra batteries. Complete the following statements about the distribution of lifetimes of all Ultra batteries. (a) According to Chebyshev's theorem, at least 36% of the lifetimes lie between (Round your answer to the nearest integer.) (b) According to Chebyshev's theorem, at least hours. a. 56% b. 75% c. 84% d. 89% hours and hours. % of the lifetimes lie between 661 hours and 1009 (c) Suppose that the distribution is bell-shaped. According to the empirical rule, approximately % of the lifetimes lie between 661 hours and 1009 hours. a. 68% b. 75% c. 95% d. 99.7% (d) Suppose that the distribution is bell-shaped. According to the empirical rule, approximately 99.7% of the lifetimes lie between hours and hours.
Step by Step Solution
3.50 Rating (157 Votes )
There are 3 Steps involved in it
Data is skewed to the left as seen by the histogram It lacks s... View full answer

Get step-by-step solutions from verified subject matter experts