Question: draw the range chart with explaining how and answer part 5 only. 1 Construct a mean and range chart for the machine part manufacturing process.

draw the range chart with explaining how and answer part 5 only. draw the range chart with explaining how and
1 Construct a mean and range chart for the machine part manufacturing process. Twenty five samples with size four are randomly selected and length is measured in centimeters, all measurements are shown in the table given below. Decide if the process is under control or not, write the reason of your decision. X1 X2 X3 X4 Sample Number 1 14.00 16.00 14.57 13.00 16.00 14.67 3 13.00 14.00 14.00 15.00 15.00 15.00 onu N 14.00 16.00 14.00 13.00 14.32 12.83 EI 4 12.00 15.00 14.36 13.28 15.45 13.57 7 15.06 18.37 16.00 14.00 14.18 16.07 8 16.64 9 15.36 15.18 13.00 14.00 10 14.30 17.28 16.70 17.67 13.36 15.09 11 14.28 14.00 15.00 14.63 15.93 13.98 12 15.78 14.45 13 12.86 16.40 14 16.46 14.95 13.59 15 14.11 14.03 12.86 15.30 17.27 15.89 16.00 15.17 13.96 12.50 11.84 16 17 15.75 13.68 15.01 18 14.16 15.80 13.06 16.54 19 13.86 14.19 14.41 15.05 17.11 12.36 13.49 a s| || 4 14.37 14.74 15.92 16.40 15.80 16.21 15.12 13.82 15.67 14.97 15.30 15.56 13.73 15.94 14.33 15.24 16.58 15.55 15.71 16.24 13.66 2. Estimate the mean and standard deviation of the process. 3. What is the probability of a Type I error? 4. What is the probability of a Type Il error if the mean shifts by +0.5? 5. What proportion of the output will be nonconforming if the specifications are given as 14+2.5

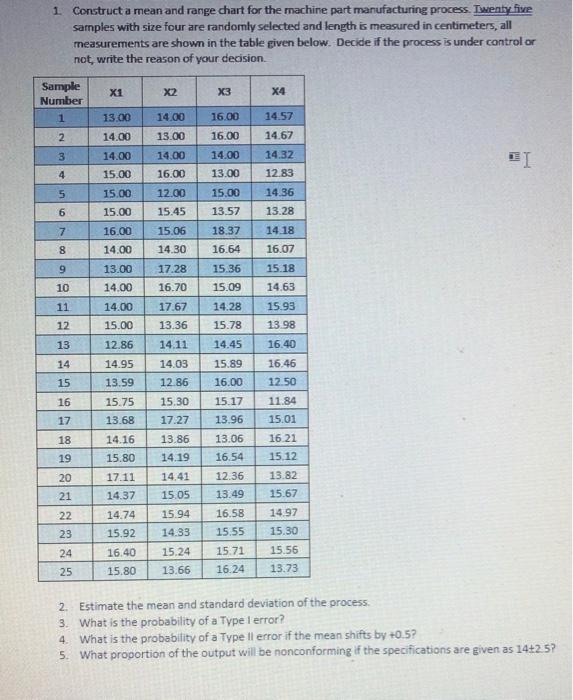
Step by Step Solution

There are 3 Steps involved in it

1 Expert Approved Answer
Step: 1 Unlock blur-text-image
Question Has Been Solved by an Expert!

Get step-by-step solutions from verified subject matter experts

Step: 2 Unlock
Step: 3 Unlock

Students Have Also Explored These Related General Management Questions!