

Question: Draw the structural formula from the spectroscopic data given below. In each case show how the fragmentation analysis () Mass Spectrum (mix) 148 (M+): 120
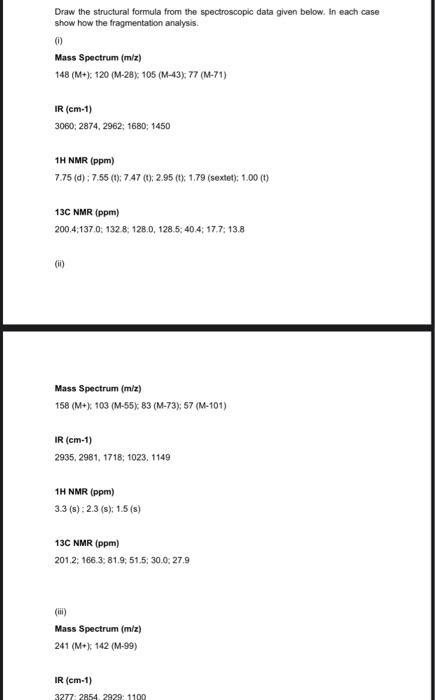
Draw the structural formula from the spectroscopic data given below. In each case show how the fragmentation analysis () Mass Spectrum (mix) 148 (M+): 120 (M-28% 105 (M-43), 77 (M-71) IR (cm-1) 3060: 2874, 2962: 1680 1450 1H NMR (ppm) 7.75 (d):7.55(1):7.47 0:2.95 (61.79 (sextet): 1.00 (1) 13C NMR (ppm) 200.4.137.0: 1328, 128.0, 128.5: 40.4; 17.7 13.8 (ii) Mass Spectrum (m/) 158 (M+), 103 (M-55): 83 (M-73); 57 (M-101) IR (cm-1) 2935, 2981, 1718, 1023, 1149 1H NMR (ppm) 3.3 (s): 2.3 (s) 1.5 (s) 13C NMR (ppm) 2012: 166.3: 81.9, 51,5; 30.0: 27.9 Mass Spectrum (m/z) 241 (M+): 142 (M-99) IR (cm-1) 3277: 2854. 2929: 1100
Step by Step Solution
There are 3 Steps involved in it
1 Expert Approved Answer
Step: 1 Unlock

Question Has Been Solved by an Expert!
Get step-by-step solutions from verified subject matter experts
Step: 2 Unlock
Step: 3 Unlock