

Question: Draw the structure and name the compound that is shown from the following data. please explain how the answer was obtained. Anna 3026 IR Spectrum
Draw the structure and name the compound that is shown from the following data. please explain how the answer was obtained. 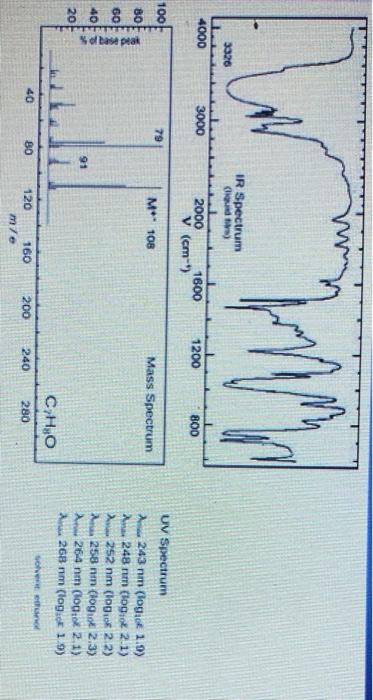
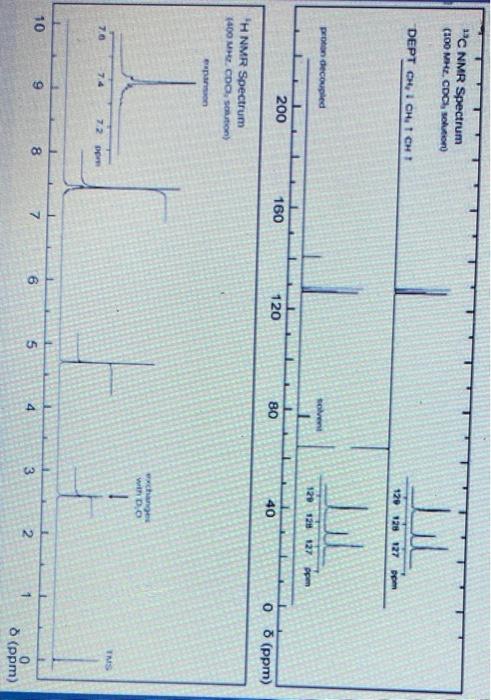
Anna 3026 IR Spectrum C) L 2000 1600 V (cm) 4000 3000 1200 800 100 79 M" 108 Mass Spectrum BO 60 NTNYTT base peat UV Spectrum 243 nm (logio 1.0) 248 nm (logio 2.1) ... 252 nm (logok 2.2) A 258 nm (logio 2.3) 264 nm (tok 2.1) 268 nm (logic 1.9) son 40 91 20 C,H,O 40 BO 120 160 mie 200 240 280 **C NMR Spectrum (100 MHE. CDC, solo DEPT CHI CH. ICH! 129 128 127 Dom pro decoupled solved 129 128 127 ppen 200 160 120 80 40 o 6 (ppm) 'H NMR Spectrum 1400 MCDO, Sun) wan wychanges with D.O TRS 7.0 74 7.2 10 9 OP 8 8 7 . 6. 5 4 3 2 0 (ppm)
Step by Step Solution
There are 3 Steps involved in it
1 Expert Approved Answer
Step: 1 Unlock

Question Has Been Solved by an Expert!
Get step-by-step solutions from verified subject matter experts
Step: 2 Unlock
Step: 3 Unlock