

Question: Draw two Histograms is the dataset provided. TABLE 1. 4 OMEGA-3 FATTY ACIDS AS A FRACTION OF OMEGA-6 FATTY ACIDS IN FOOD OILS OIL RATIO

Draw two Histograms is the dataset provided.
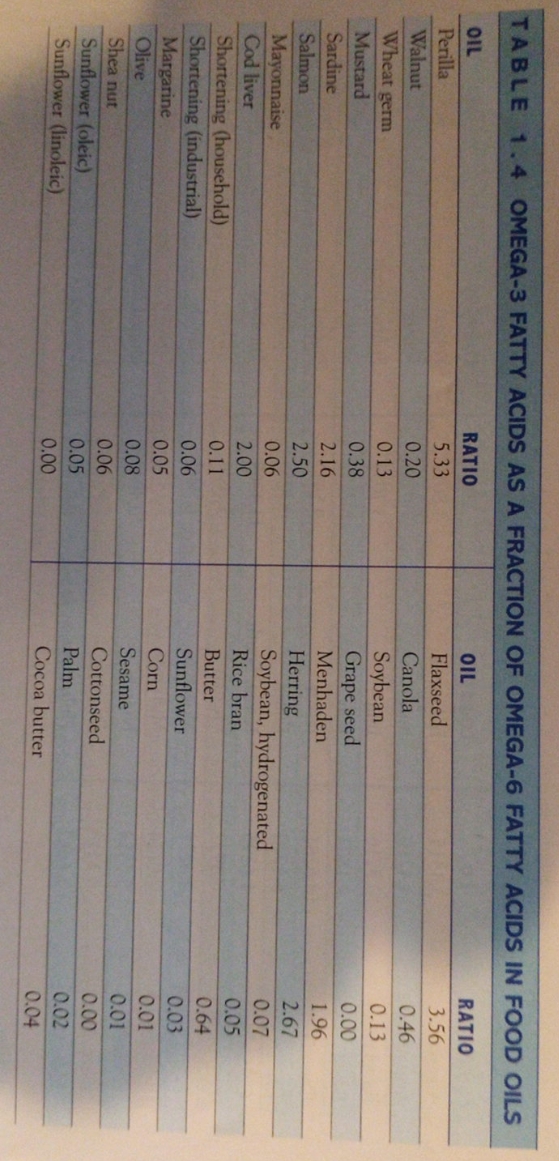
TABLE 1. 4 OMEGA-3 FATTY ACIDS AS A FRACTION OF OMEGA-6 FATTY ACIDS IN FOOD OILS OIL RATIO OIL RATIO Perilla 5.33 Flaxseed 3.56 Walnut 0.20 Canola 0.4 Wheat germ 0.13 Soybean 0.13 Mustard 0.38 Grape seed 0.00 Sardine 2.16 Menhaden 1.96 Salmon 2.50 Herring 2.67 Mayonnaise 0.06 Soybean, hydrogenated 0.07 Cod liver 2.00 Rice bran 0.05 Shortening (household) 0.11 Butter 0.64 Shortening (industrial) 0.06 Sunflower 0.03 Margarine 0.05 Corn 0.01 Olive 0.08 Sesame 0.01 Shea nut 0.06 Cottonseed 0.00 Sunflower (oleic) 0.05 Palm 0.02 Sunflower (linoleic) 0.00 Cocoa butter 0.04
Step by Step Solution
There are 3 Steps involved in it
1 Expert Approved Answer
Step: 1 Unlock

Question Has Been Solved by an Expert!
Get step-by-step solutions from verified subject matter experts
Step: 2 Unlock
Step: 3 Unlock