

Question: Drawing Tools Click to fir OO Chart Blank Breaks Table LX Page Picture Shapes Icon Library Chart Library WPSArt # Screenshot Comment Envelopes Header and
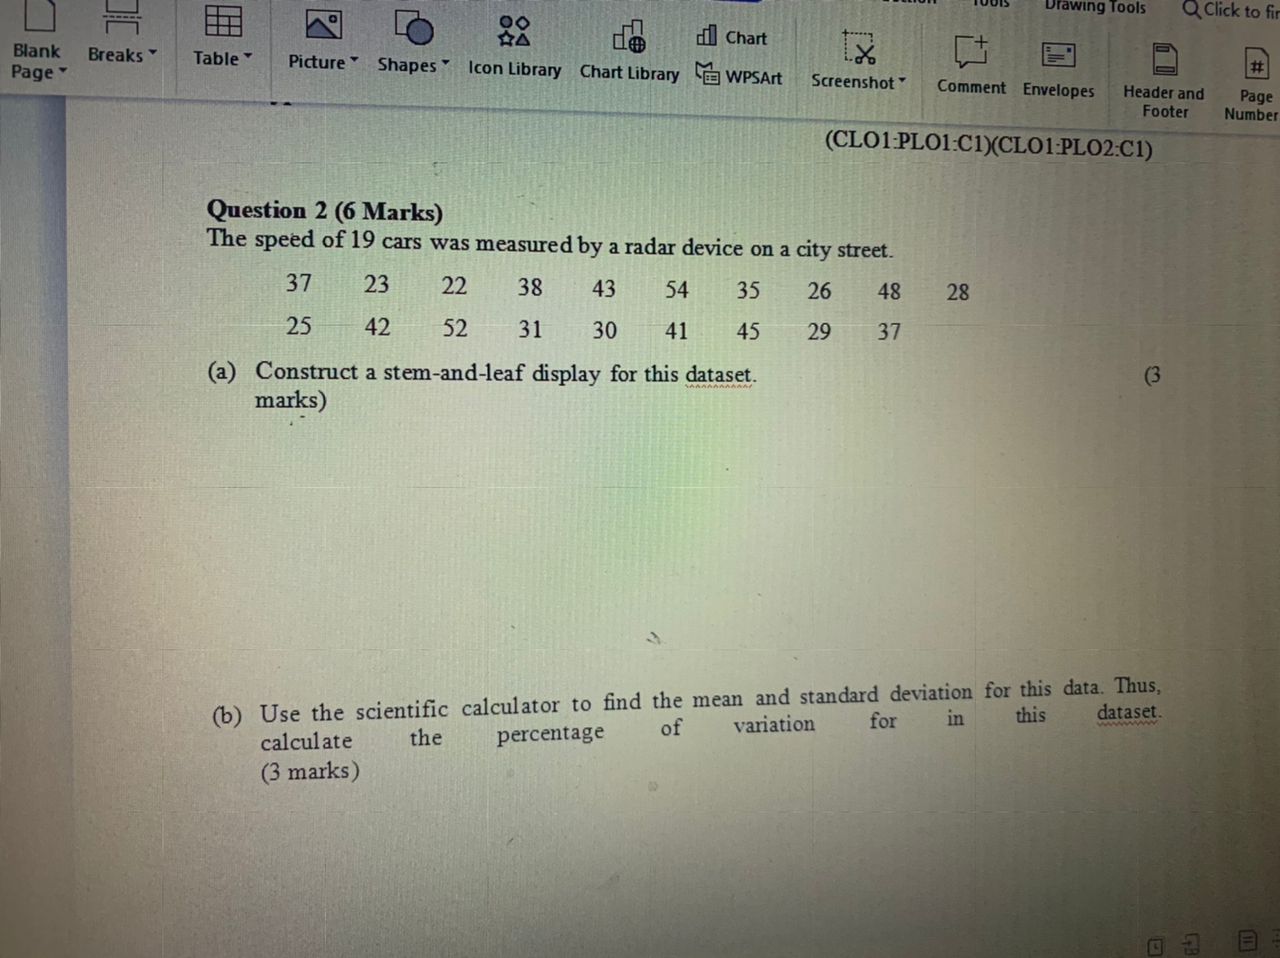
Drawing Tools Click to fir OO Chart Blank Breaks Table LX Page Picture Shapes Icon Library Chart Library WPSArt # Screenshot Comment Envelopes Header and Page Footer Number (CLO1:PLO1:C1)(CLO1:PLO2:C1) Question 2 (6 Marks) The speed of 19 cars was measured by a radar device on a city street. 37 23 22 38 43 54 35 26 48 28 25 42 52 31 30 41 45 29 37 (a) Construct a stem-and-leaf display for this dataset. (3 marks) (b) Use the scientific calculator to find the mean and standard deviation for this data. Thus, in this dataset. calculate the percentage of variation for
Step by Step Solution
There are 3 Steps involved in it
1 Expert Approved Answer
Step: 1 Unlock

Question Has Been Solved by an Expert!
Get step-by-step solutions from verified subject matter experts
Step: 2 Unlock
Step: 3 Unlock